
Figure 3.
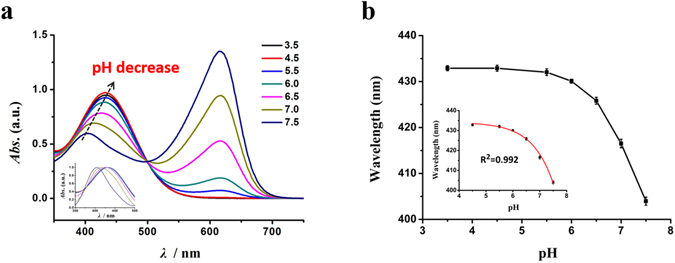
UV-Vis absorption spectra and calibration curve of bromothymol blue/PBS solutions with different pH values. (a) Traditional UV-Vis absorption spectra of bromothymol blue/PBS solutions (10 mM) with varied pH values. The inset is the normalized UV-Vis absorption spectra of 350–500 nm for bromothymol blue/ PBS solutions (10 mM) with varied pH values. (b) The calibration curve of bromothymol blue solutions in terms of the pH-dependent UV-Vis absorption peak for pH measurements. Inset shows the calibration curve from pH 4.5 to 7.5. The error bars illustrate the relative standard deviation (RSD) over three replicates.