
Figure 4.
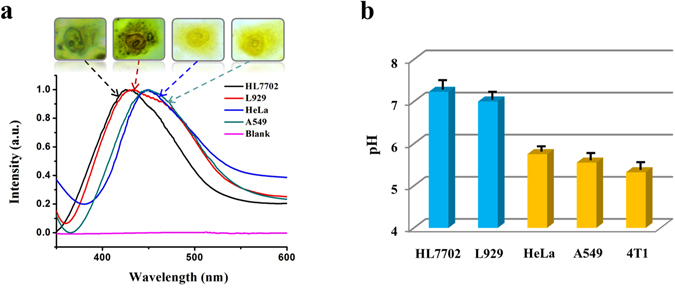
Single-cell pH accurate detection and profiling by the microspectroscopy-based UV-Vis colorimetric method. (a) Normalized bright-field microscope-based single-cell absorption spectra and corresponding single-cell microscope images of HL7702, L929, HeLa, and A549 cells recorded by our UV-Vis microspectroscopy, after the treatment with bromothymol blue. (b) Histogram of the pH distribution for single HL7702, L929, HeLa, A549, and 4T1 cells, respectively, detected by the method with error bars based on at least twenty single cells for each cell line.