Figure 5.

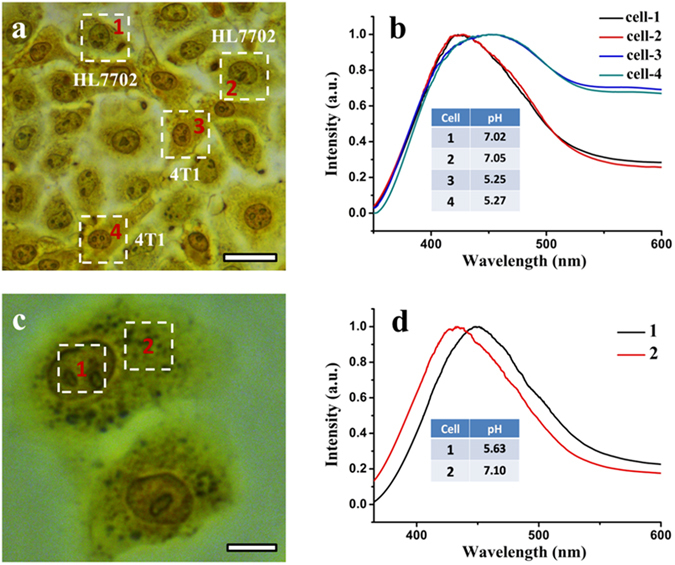
Cancer cell identification from cocultured normal cells by pH imaging and detection, and sub-cellular pH detection. (a) A bright-field optical microscope image of the cocultured HL7702 and 4T1 cells treated with bromothymol blue. Four intact single cells (with corresponding spectrum acquisition area marked by a dotted white square) were randomly selected for single-cell pH detection. Scale bar: 20 μm. (b) Corresponding normalized bright-field microscope-based single-cell absorption spectra of the four selected cells as denoted in (a). (c) A bright-field optical microscope image of 1L929 cells treated with bromothymol blue. A single L929 cell marked by two dotted white squares (in different parts of the cell) was selected for sub-cellular pH detection. Scale bar: 10 μm. (d) Corresponding normalized sub-cellular absorption spectra of the L929 cell taken from the two different parts of the cell as denoted in (c).
