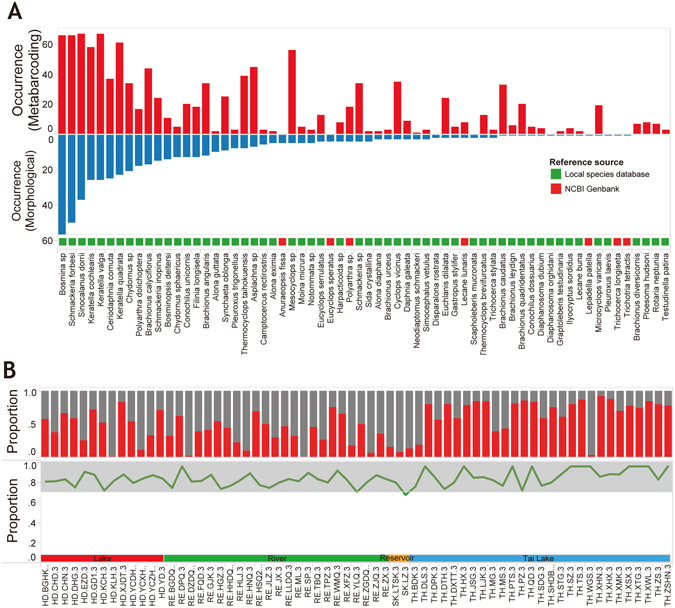
Figure 2.

Comparison of metabarcoding data with traditional monitoring data on zooplankton species monitoring. (A) Frequency of occurrence of each species by metabarcoding and morphological method. (B) The top panel shows the proportion of OTUs in metabarcoding data matched to the morphological identification at each site. Red color indicates the proportion of species detected by both morphological method and metabarcoding. Grey color indicates the proportion of species detected by metabarcoding only. The bottom panel shows the proportion of species detected by metabarcoding at each sample. (e.g. 0.8 means 80% morphological species detected by metabarcoding).
