
Figure 5.
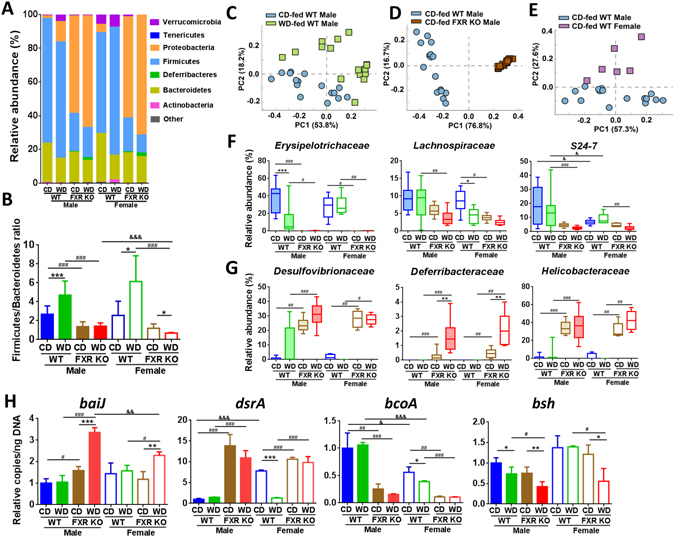
Diet and FXR deficiency changed gut microbiota composition in both genders. (A) Cecal microbiota at phylum level. (B) Firmicutes to Bacteroidetes ratio. Principal component analysis plots of cecal microbiota at family level based on diet (C), phenotype (D), and gender difference (E). (F) and (G), relative abundance of cecal microbiota at family level (Kruskal-Wallis test). Box plots display the median, 25th percentile, and 75th percentile; whiskers display minimum and maximum values. (H) Targeted functional quantitative PCR analysis of microbial genes. (B,H), data are expressed as mean ± SD. One-way ANOVA with Tukey’s correction. n = 16 in male groups, n = 6 in female groups. *p < 0.05, **p < 0.01, ***p < 0.001 for diet comparison; # p < 0.05, ## p < 0.01, ### p < 0.001 for genotype comparison; & p < 0.05, && p < 0.01, &&& p < 0.001 for gender comparison.