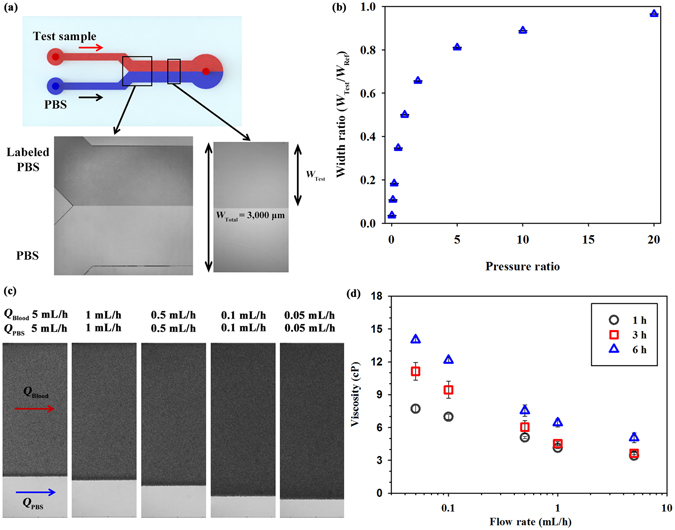
Figure 2.

Measurement of variation in viscosity based on interfacial width between the test sample and PBS solution. (a) Schematic of the Y-shaped microfluidic device. An interfacial line is formed between the test sample and PBS solution by separately delivering the two fluids to each inlet of the microfluidic device. Optical images of the labeled PBS and PBS flows in the confluence region and interesting region. The channel downstream has a width (W Total) of 3000 μm and a height (H) of 50 μm. The width of the test fluid (W Test) is measured with image processing techniques. (b) Variation of the width ratio (W Test /W Total) according to pressure ratio between the labeled PBS and PBS solutions. After obtaining a fitting curve of the width ratio based on the regression analysis for the labeled PBS and PBS solutions, the pressure ratio between the two fluids is estimated from the width ratio curve. (c) Magnified images representing variations in the interfacial width of the blood samples (W Test) and PBS solution according to flow rate (Q Blood and Q PBS = 0.05 − 5 mL/h). (d) Variations in blood viscosity according to flow rate and lapsed time after LPS injection.
