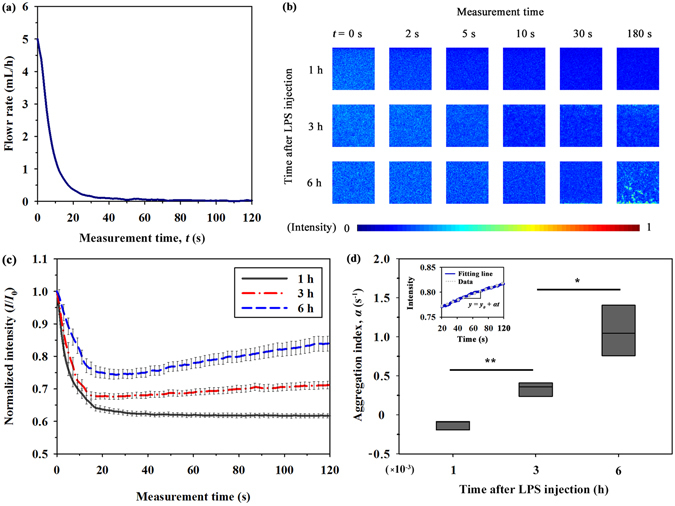
Figure 3.

Variation in RBC aggregation measured by analyzing image intensity. (a) Temporal variation in flow rate of blood samples estimated by micro-PIV technique. (b) A series of speckle images for blood samples after the lapse of 1, 3, and 6 h from LPS injection with respect to measurement time. The size of each image is 128 × 128 pixels, corresponding to 0.64 × 0.64 mm2 in the physical dimension. (c) Temporal variations in the normalized light intensity (I/I 0) of blood samples after 1, 3, and 6 h from LPS injection at the center of the channel. (d) Comparison of aggregation index (α) according to the measurement time after LPS injection. Light intensities of blood samples at 6 h after LPS injection, and the corresponding fitting curves are inserted. (*p < 0.005 and **p < 0.001: significant difference between groups).
