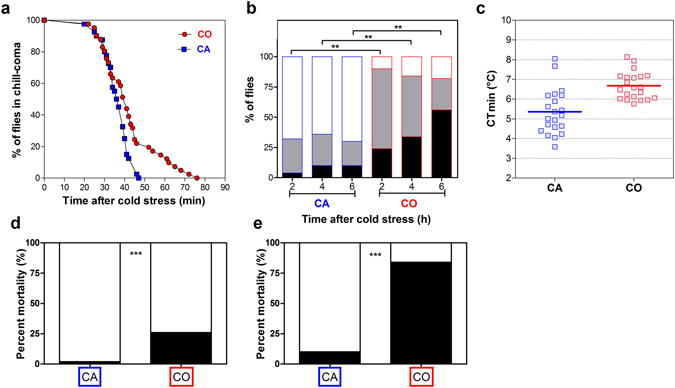
Figure 2.

(a) Comparison of chill coma recovery dynamics in CA (blue squares) vs. CO (red circles) flies. Time to recover from chill coma was monitored in flies recovering at 25 °C after 9 h of chronic cold stress at 0 °C (n = 40). (b) Climbing activity monitored in CA vs. CO flies recovering flies after 2, 4 and 6 h following 9 h at 0 °C. Flies were categorized as fit (white part) or recovering (grey part) or injured (black part) (n = 50). (c) Critical thermal minimum (CTmin) in the two groups tested. The horizontal lines indicate the mean value (n = 21). Mortality rate (black part) in CA and CO flies recovering for 24 h at 25 °C after 9 h of chronic cold stress at 0 °C (n = 50) (d) or 2 h of acute cold stress at −3.5 °C (n = 50) (e). Symbols (*) indicate a significant difference (p < 0.05).
