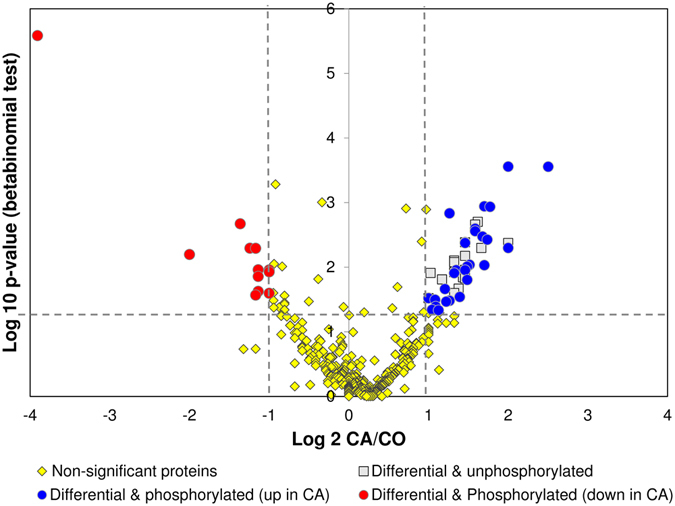
Figure 6.

Volcano plot constructed from weighed spectral counts. The plot shows how much and how significant the identified proteins were differentially abundant between CA and CO flies. Horizontal dotted line depicts a p < 0.05 cutoff and vertical dotted lines depict 2- and 0.5-fold cutoffs. Among 64 significant differential proteins (i.e. above cutoff values), 18 were identified without phosphorylated peptides (grey squares), 12 were phosphorylated and less abundant in the CA samples (red circles) and 34 were phosphorylated and more abundant in the CA samples (blue circles).
