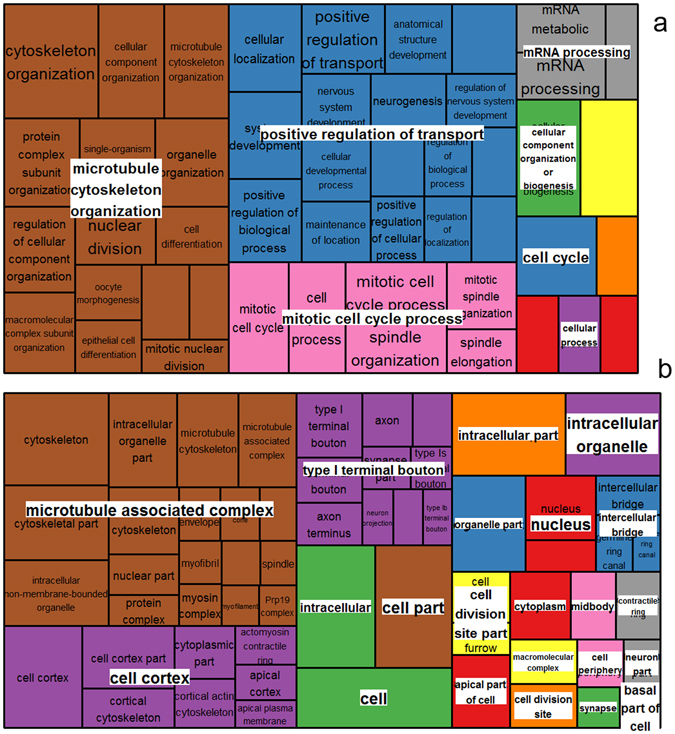
Figure 8.

Illustration of superclusters of overrepresented GO-terms visualized in semantic similarity-based treemap views from REVIGO program, for biological process (a) and cellular component (b). Rectangles in the treemaps are size-adjusted to reflect the corrected p-value (i.e. larger rectangles represent the most significant GO-terms). Each rectangle in the treemap view has a single cluster for representation. These representatives are further joined together to build superclusters that are related terms and displayed in different colours.
