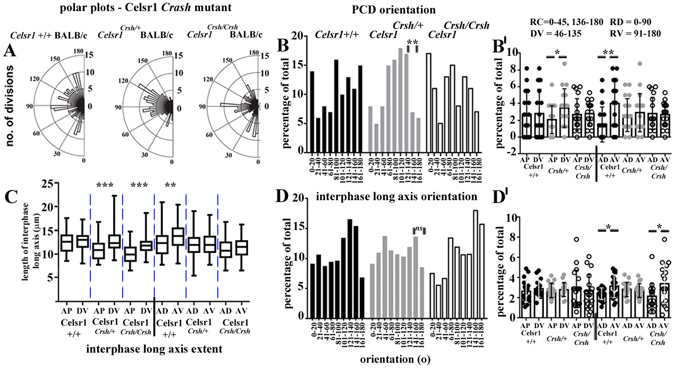
Figure 3.

A role for Celsr1 in planar cell division orientation across the mammalian epidermis. (A) polar plots of total planar oriented cell divisions in E16 Celsr1 Crsh mutant litters. E15.5 litters exhibited a similar pattern to E16 (data not shown). Blind analyses were performed for wild-type and heterozygote Crsh littermates, >4 embryos from 4 litters for each group and for each wild-type. (B,D) histograms of PCD and long axis orientation, range of bin widths is shown along the X-axis. (B,D’) scatter plots of PCD and long axis orientation, mean and SD are shown. (C) whisker box plots showing the extent of the longest axis (length between the two shortest opposing interfaces) of basal epithelial cells for each condition. Box plots show maximum and minimum, median and 75% and 25% percentile values. Statistical analysis was Student’s t-test, *denotes P-value > 0.01; **denotes P-value > 0.001; ***denotes P-value > 0.0001.
