Figure 6.

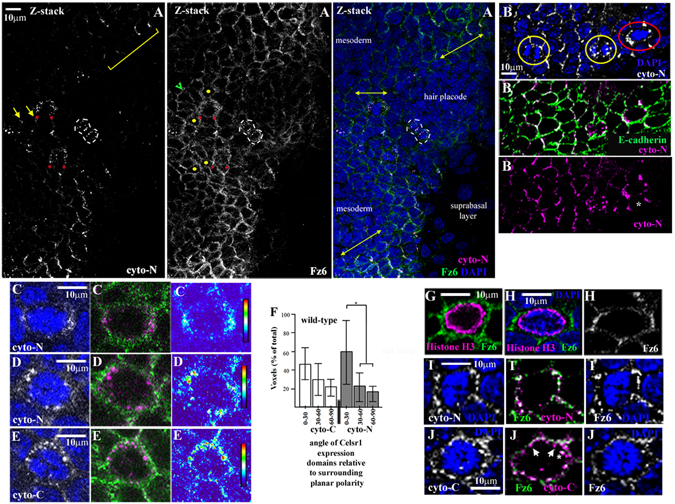
Fz6 and Celsr1 asymmetry is retained during epidermal progenitor mitosis (A–E,G–M). Immunostaining analysis, representative images of ‘en-face’ frozen sections. Anterior is the left, dorsal is roughly to the top. Vertical bars in heat maps (C–E) represent the scale of fluorescence intensity (AU), red is high and blue is low. Representative images are shown. We found cell surface cyto-N asymmetry in early stage mitoses independent of whether surrounding asymmetry in neighbouring interphase cells was coherent or fragmented. (A–E) wild-type C57BL6 skins n > 3 unless otherwise stated (A) ‘en-face’ view of an epidermal field. Yellow double headed arrows (Z-stack reconstruction; right hand panel) highlight the prevailing local axis of planar polarity. Red asterisks label clear cyto-N asymmetry in two early stage mitoses. Yellow dots label neighbouring interphase cells whose long axis is aligned with the axis of local planar polarity. Green arrowhead labels neighbouring interphase cells whose long axes do not align with the local axis of planar polarity. Yellow bracket in left hand panel highlights representative example of cyto-N fragmentation in background of Fz6 isotropy. A mitotic cell in cytokinesis is outlined by dashed white lines. Note the accumulation of both Celsr1 and Fz6 intracellular puncta at the cytokinetic furrow suggesting the polarised reappearance of core protein cell surface asymmetry but along an axis of planar polarity than is almost perpendicular to the prevailing local planar polarity axis. (B) 3 basal cell divisions aligned along the A-P axis at different mitotic stages are highlighted by coloured circles. Early phase cell division in red circle exhibits cell surface asymmetry of cyto-N staining which aligns with local axis of planar polarity in neighbouring interphase cells. (C) n = 6/16 mitoses (D) n = 10/16 mitoses (E) n = 20/20 mitoses (G) n = 90/125 mitoses (I) n = 6/6 mitoses (J) asterisk labels intracellular puncta co-expressing Fz6 and Celsr1cyto-C proteins, white arrows label intracellular puncta expressing Celsr1cyto-C proteins but not Fz6. (F) histogram showing binned angles of Celsr1 expression domains in early stage mitoses, asterisk indicates two-tailed t-test, (p < 0.01), n > 20 mitoses in each case.
