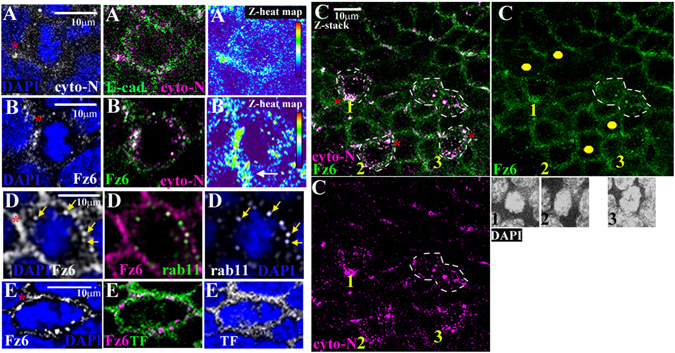
Figure 7.

Fz6 and Celsr1 exhibit uni-polar asymmetry as the mitotic spindle forms (A–E) immunostained ‘en-face’ frozen sections. Mitoses were oriented along the surrounding axis of planar polarity, dorsal is roughly to the top, anterior is left. Z-heat maps show Z-stack reconstructions of Celsr1 distribution during early mitosis (A) n = 2, asterisk labels uni-polar focal enrichment of Celsr1 (B) n > 3, asterisk labels uni-polar focal enrichment of Fz6 and Celsr1 at interface with neighbouring interphase cell, arrow labels Celsr1 enrichment in interphase neighbour (C) representative image, n = 3. Three early stage mitoses, labelled 1,2,3 together with a mitosis in cytokinesis (white dashed lines) whose plane of cell division is perpendicular to the axis of local planar polarity marked by cyto-N and Fz6. Yellow dots label neighbouring interphase cells with a long axis aligned with the axis of local planar polarity. Z-stack reconstructions of the nuclear mass for each early stage mitosis are shown underneath the right hand panel. (D) arrows label intracellular puncta co-expressing Fz6/rab11, n = 3. (E) TF is transferrin, n = 4, asterisk labels uni-polar Fz6 cell surface enrichment.
