
Figure 3.
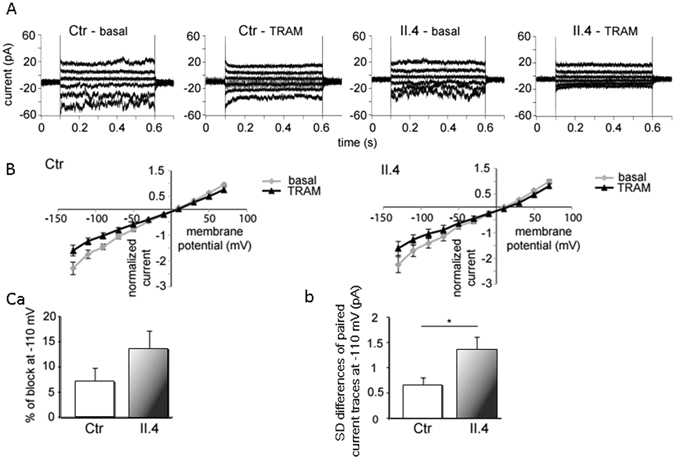
Whole-cell recordings of KCNN4 (Gardos channel) currents in RBCs from healthy donors and patient II.4. Currents were elicited by voltage steps from −130 mV to 70 mV for 500 ms in 20 mV increments at Vh = −30 mV and recorded in the absence and after application of 1 µM TRAM-34, a specific Gardos channel blocker. (A) Raw current traces from healthy and mutated RBCs in the absence (basal) and in the presence of 1 µM TRAM-34 as indicated above the recordings. For clarity, in all the panels, not all the traces, but every second one, starting with −130 mV, are being shown. (B) Corresponding I/V-curves in the absence of 1 µM TRAM-34, basal (grey diamonds) and in the presence of 1 µM TRAM-34 (black triangles) for healthy (Ctr) and mutated (II.4) RBCs. Data are expressed as mean current ± SEMs. (C) Differences in Gardos currents between healthy (n = 27 cells) and mutated RBCs (n = 23 cells) at −110 mV. (Ca) compares the percent of block (by 1 µM TRAM-34) of mean currents in healthy and mutated RBCs. Due to the small number and small single channel conductivity of Gardos channels in RBCs an additional assessment of Gardos currents is given by analysis of the kinetics of current traces. A mean whole-cell current being the result from the summation of many smaller unit currents flowing through single ion channels, exhibits fluctuations or “noise” about its mean level. (Cb) compares the difference in the standard deviation (SD) of current traces (with and without 1 µM TRAM-34) between control and patient RBCs. Significance was checked based on an unpaired t-test *p < 0.05.