
Figure 5.
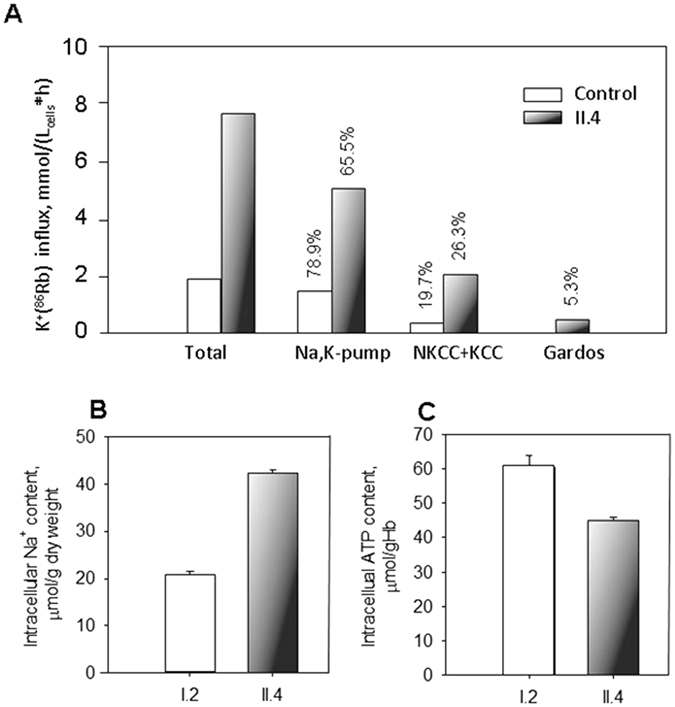
Activity of ion transporters, intracellular Na+ and ATP content in circulating RBCs. (A) Unidirecitonal K+(86Rb+) influx into RBCs of a healthy control and patient II.4. Shown in the panel are bulk K+ influx and the influx components carried by the Na,K-pump (ouabain-sensitive flux) and the fluxes mediated by the chloride-dependent influx mediated by Na,K,2Cl-, K,Cl-cotransporters, and Gardos channel activity (TRAM-34-sensitive flux). White bars show the flux values for RBCs of healthy control and black bars are for the fluxes in II.4 patient’s RBCs. Numbers above the bars indicate the contribution of each ion transporter into the total influx of either patient or healthy control in %. Intracellular Na+ (B) and ATP (C) content of RBCs of the healthy I.2 (white bar) and patient II.4 (black bar) measured in triplicates on one occasion. Data are mean ± SD. Although statistical analysis could not be performed for single experiments all the values show clear difference between the I.2 and II.4 (for intracellular Na+ and ATP levels) as well between the RBCs of II.4 and identically treated healthy control for all the K+(86Rb+) flux components.