
Figure 2.
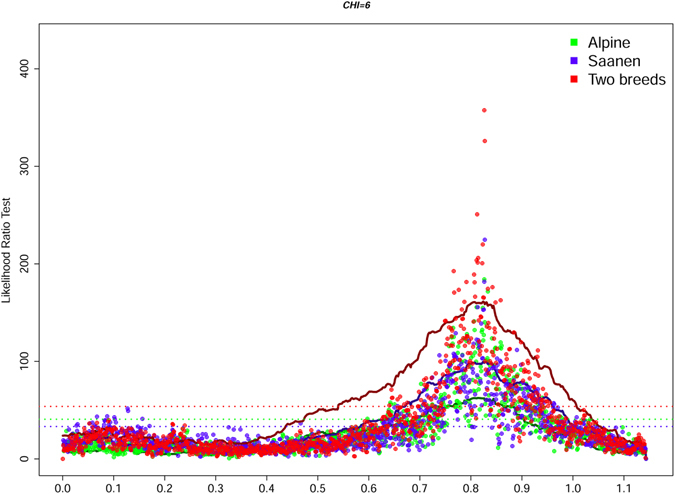
Global likelihood ratio test profiles for protein content on CHI 6 based on both linkage and haplotype-based linkage (solid lines) and association (dotted line) analyses. The dotted horizontal lines represent 5% genome-wide thresholds.
Official websites use .gov
A
.gov website belongs to an official
government organization in the United States.
Secure .gov websites use HTTPS
A lock (
) or https:// means you've safely
connected to the .gov website. Share sensitive
information only on official, secure websites.
Global likelihood ratio test profiles for protein content on CHI 6 based on both linkage and haplotype-based linkage (solid lines) and association (dotted line) analyses. The dotted horizontal lines represent 5% genome-wide thresholds.