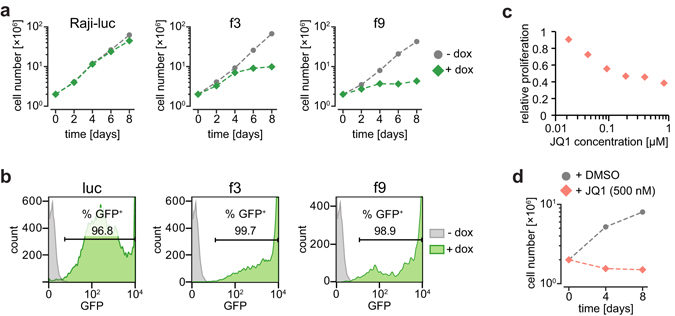
Figure 2.

Proliferation assay of Raji cells expressing f3 and f9 or after treatment with JQ1. (a) Non-induced (gray) and induced cells (25 ng/ml doxycycline, green) were plotted. Induced cells expressed either luciferase (Raji-luc, negative control) or dominant-negative Brd4 mutants f3 and f9. (b) Percentage of induced cells (green) were assessed by measuring GFP reporter signals using flow cytometry. Uninduced Raji f2 cells served as negative control (gray). (c) Raji cells were treated with increasing concentrations of JQ1 for 72 hours. Cell proliferation was measured via MTS assay and plotted against JQ1 concentration (log scale). (d) Induced Raji-luc cells were treated with 500 nM JQ1 (red)/DMSO (gray, control) for 8 days. Living cell numbers were counted and plotted against time.
