Figure 4.

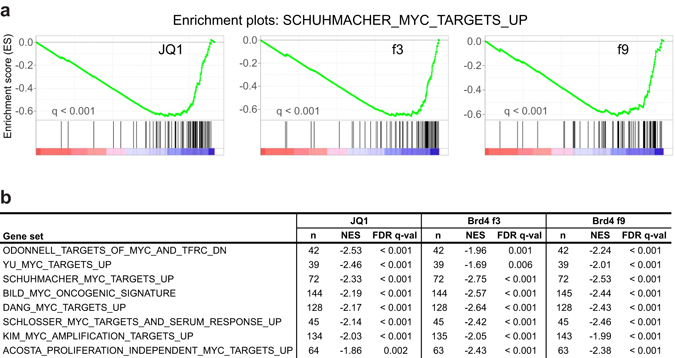
Gene set enrichment analysis (GSEA) of c-Myc target genes. (a) C-Myc signature enrichment plots in Raji-luc + 500 nM JQ1, Brd4 f3, and Brd4 f9 cells versus DMSO-treated Raji-luc cells as a control for all three conditions. Plots were prepared using the SCHUHMACHER_MYC_TARGETS_UP24 dataset (containing genes upregulated by c-Myc) available at the Molecular Signatures Database51. C-Myc upregulated target genes were enriched at the bottom of the ranked list of genes (ranking according to log2 fold-changes obtained from the previous DE analysis), indicating that genes upregulated by c-Myc tended to be repressed. (b) Table of selected c-Myc target gene sets24–31 enriched in all three samples. n = number of genes in each set; NES = normalized enrichment score; FDR q-val = test of statistical significance. Negative NES indicates that genes in the respective target gene sets tended to be repressed.
