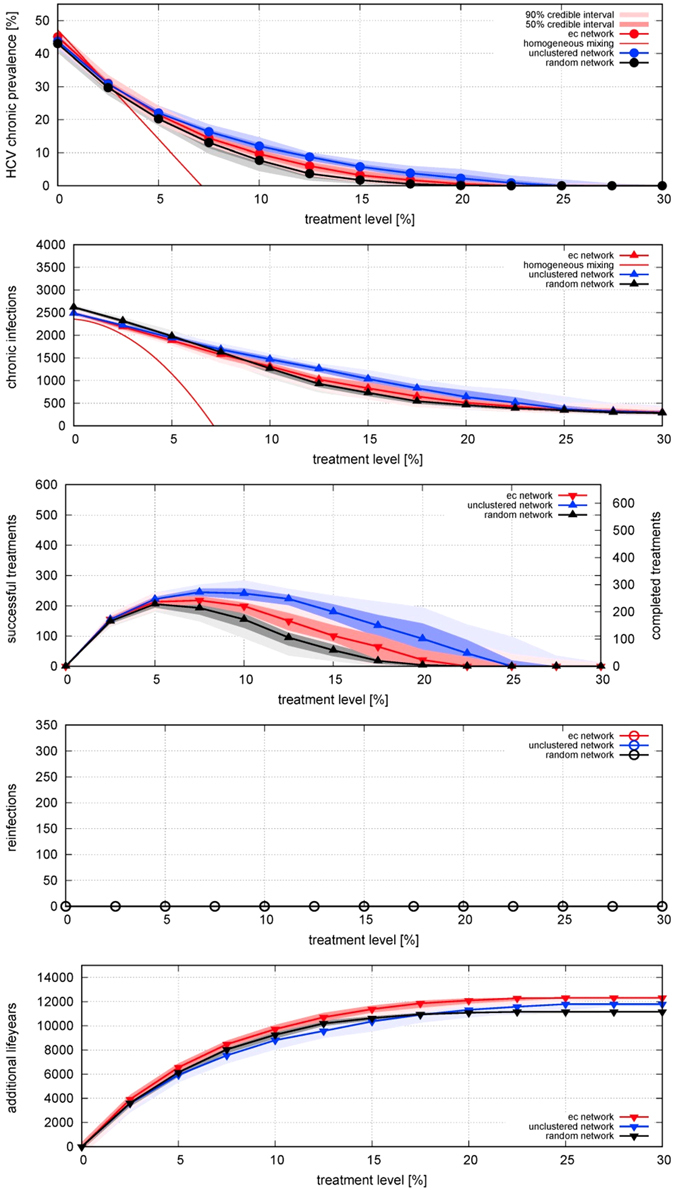
Figure 4.

Effect of different treatment rates on equilibrium (A) prevalence of HCV infection; incidence per year of (B) chronic infection, (C) cured by successful treatment, (D) reinfection – which is always zero in this scenario because cured individuals change their behaviour to eliminate their reinfection risk; and (E) life-years gained; for three different network structures, for treatment rates varied from 0 to 30% per year, with behaviour-change post-treatment preventing reinfection. Points indicate median results and shading represents the 50% range (i.e. inter-quartile range) and 90% ranges of 100 model realizations of a network with 1000 PWID over a time period of 20 years (i.e. turnover of 50 people entering and exiting per year). For prevalence and incidence, the behaviour of the homogeneous-mixing model is also shown: as it is a deterministic model there is no range of uncertainty.
