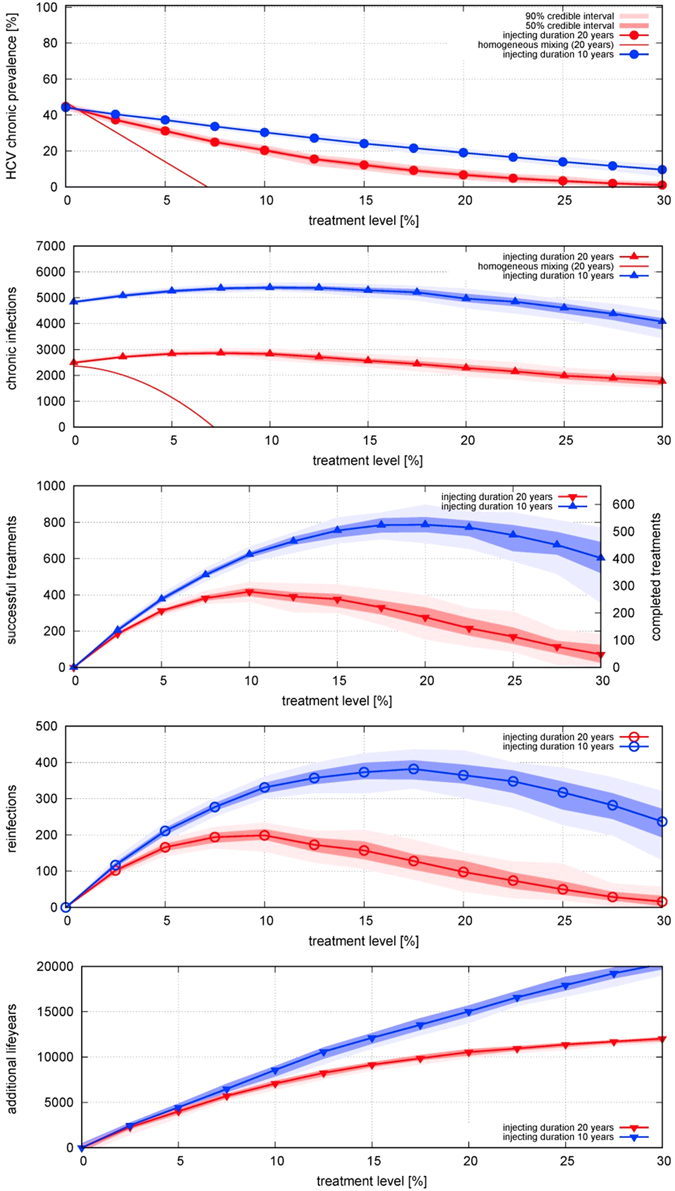
Figure 5.

Comparison of injecting career duration of 20 years (red) and 10 years (blue) for the ec-network on the effect of different treatment rates on equilibrium (A) prevalence of HCV infection; incidence per year of (B) chronic infection (including arising from reinfection), (C) cured by successful treatment, (D) reinfection; and (E) life-years gained, for treatment rates varied from 0 to 30% per year. For the shorter injecting career duration, the number of individuals entering and leaving is twice as high (100/year) for a system of the same size (1000 individuals). The infection rate has been fitted to obtain 43% prevalence of chronic infection in the absence of treatment (α is 1.3 times the one for 20 years). For an infection duration of 10 years (close to the assumption in ref. 22), treatment is much less effective in reducing prevalence.
