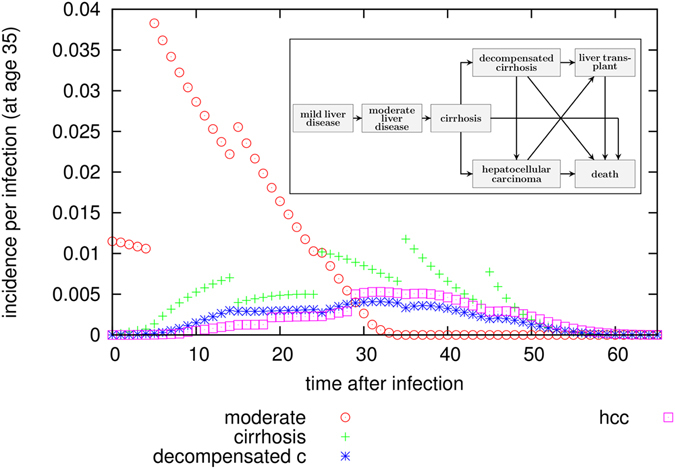
Figure 6.

Probability for incidence of progression states as a function of time after infection. These probabilities are calculated separately for each infection age (in this figure this is 35 years of age), since we use age-dependent disease progression values40 as well as mortality data39. From these values, cumulative incidences as a time after infection can be calculated, and from that the average number of life years lost (again as a function of time of infection), which allows to calculate an estimate on the number of life-years saved at system-level via comparison of two scenarios. The lines of points are discontinuous because disease progression parameters are age-dependent and sometimes differ strongly between age-groups.
