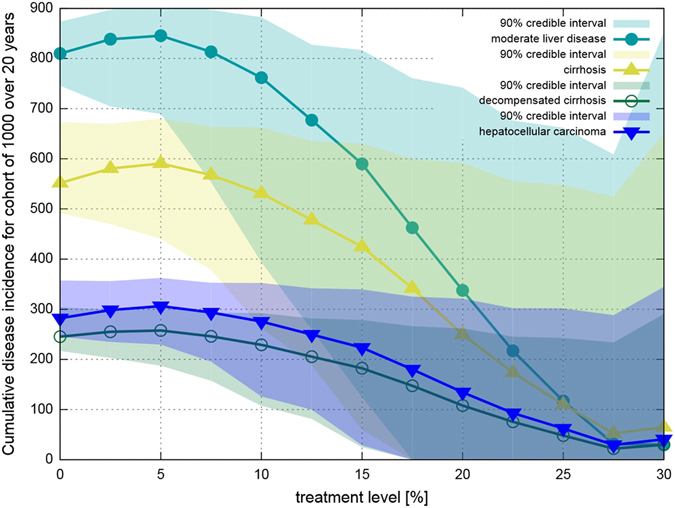
Figure 7.

Cumulative number of cases of liver disease progression states as a function of treatment level, calculated for a population of 1000 PWID for infections occurring over a 20 year timespan. The credible intervals given here are for 100 simulations; disease progression follows the age-dependent probabilities of40 exactly. The lines are discontinuous because disease progression parameters are age-dependent and sometimes differ strongly between age groups.
