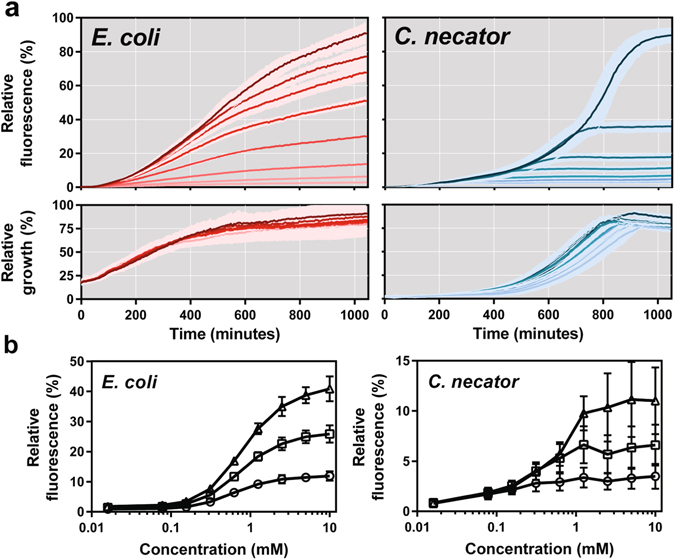
Figure 5.

Induction dynamics and kinetics of the PpHpdR/PhpdH switchable system. (a) Relative fluorescence and absorbance curves of E. coli MG1655 and C. necator H16 cultures harbouring the native PpHpdR/PhpdH switchable system, pEH008. 3-HP was supplemented at time zero to the final concentrations of 10, 5, 2.5, 1.25, 0.625, 0.156, 0.016 mM and no inducer. The darker the shade of colour, the higher the level of 3-HP. The standard error of three biological replicates is illustrated as band. (b) Dose response curve of the PpHpdR/PhpdH switchable system in E. coli MG1655 and C. necator H16. It illustrates the relation between inducer concentration and fluorescence output 4 (circle), 6 (square) and 8 (triangle) hours after 3-HP addition. Inducer levels range from 0, 0.016, 0.078, 0.156, 0.313, 0.625, 1.25, 2.5, 5 and 10 mM. Error bars represent standard deviations of three biological replicates.
