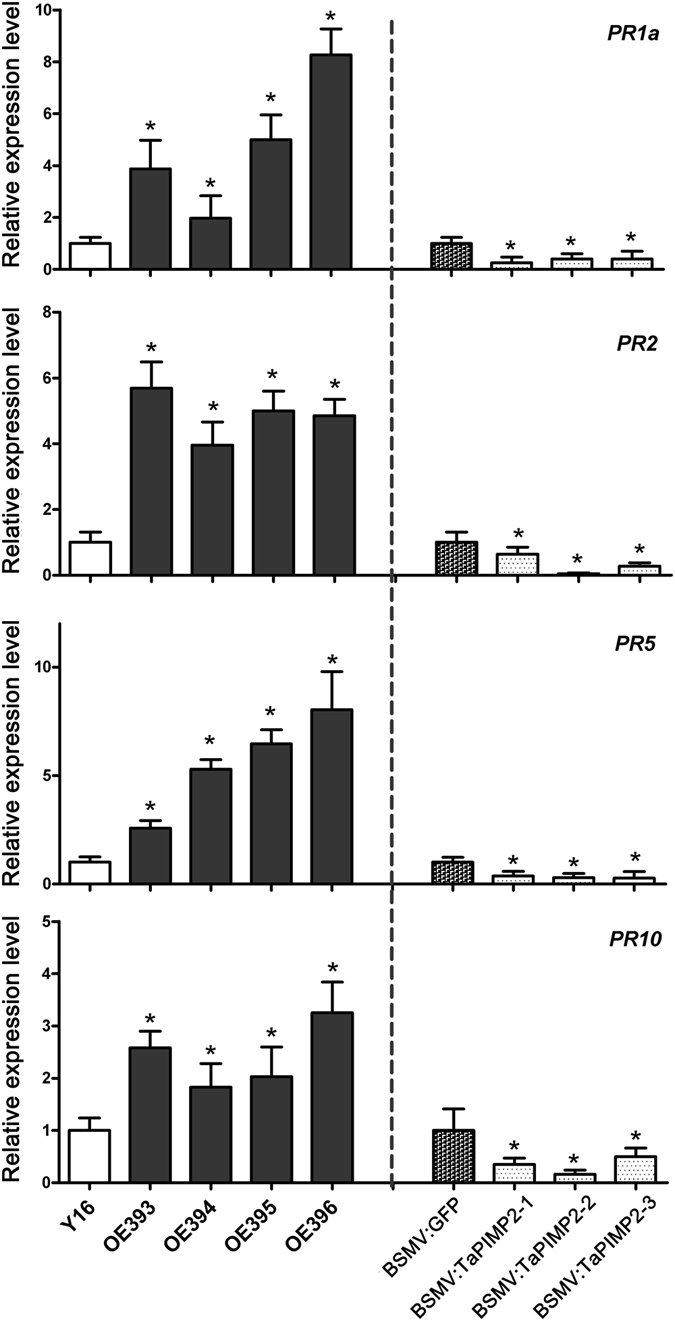
Figure 8.

Expression of defense-associated genes in TaPIMP2-overexpressing wheat lines and TaPIMP2-silenced wheat plants by RT-qPCR. The transcript levels of these genes in TaPIMP2-overexpressing wheat lines are relative to those in untransformed Yangmai 16, whereas the levels in TaPIMP2-silenced wheat plants are relative to those in the control plants infected with BSMV:GFP. Values represent the average standard error of three independent biological replicates (Student’s t-test: *P < 0.05).
