Fig. 1.
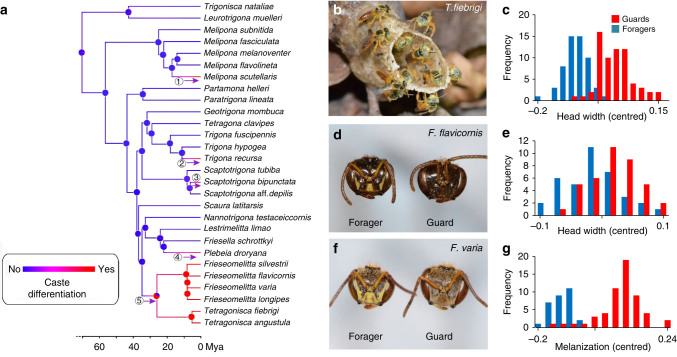
Comparison of guards and foragers in 28 species of stingless bees. a Phylogenetic reconstruction based on a previously published phylogeny18. The color gradient from blue to red indicates the probability that a species evolved increased guard size, based on 1,000 simulations using a Bayesian framework. Numbers 1–5 indicate independent appearances of increased guard size. b Tetragonisca fiebrigi guards standing on the wax entrance tube (Photo: C. Grüter). c Size-frequency distribution of T. fiebrigi foragers and guards showing a bimodal distribution. Values (unit = mm) are centred for each colony (colony mean and total mean = 0) to correct for overall colony differences (N = 58 forager/65 guards/6 colonies). d Frieseomelitta flavicornis guard and forager (Photo: C. Grüter). e Size-frequency distribution of F. flavicornis foragers and guards, showing a unimodal distribution. Values (unit = mm) are centred for each colony (N = 37/39/6). f Head of a Frieseomelitta varia forager and guard (Photo: C. Grüter). g Melanization frequency distribution of F. varia guards and foragers. Values (unit = melanization level, see methods) are centred for each colony (N = 30/56/6)

