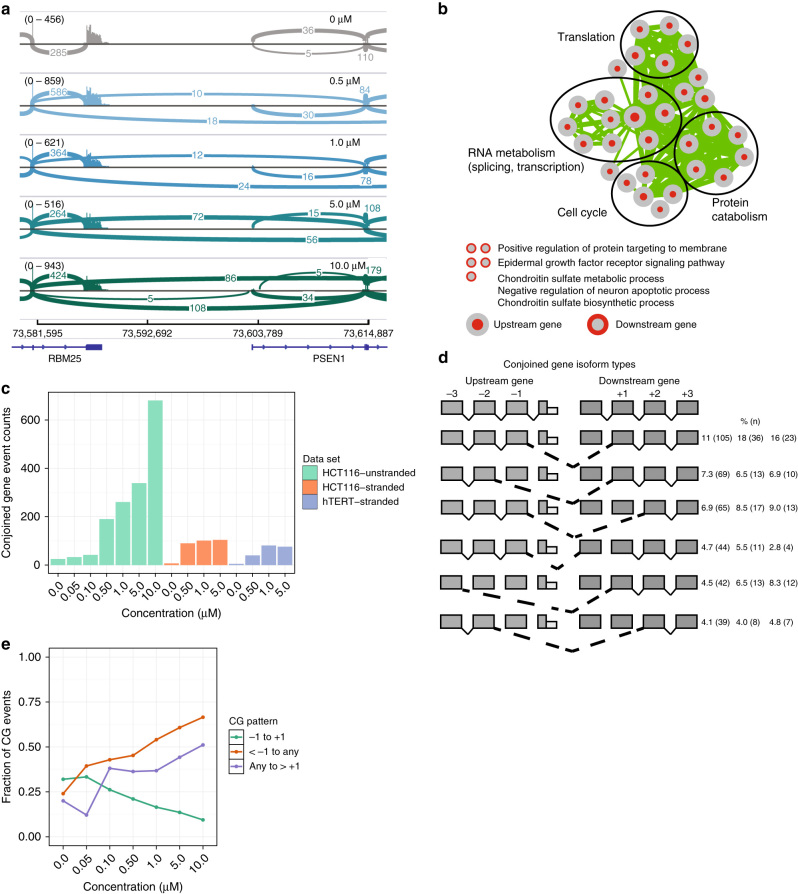
Fig. 3.
Characteristics of CG transcripts induced by inhibition of CLK. a IGV-generated sashimi plot62 of the RBM25-PSEN1 CG. Plots for T3 treatment concentrations of 0.0, 0.5, 1.0, 5.0, and 10.0 µM are shown from top to bottom. The control sample plot is colored gray, and the treated sample plots are colored according to T3 concentration. RefSeq gene annotations are shown in blue at the bottom of the plot along with chromosome 12 coordinates (bp). For each sample, the y-axis represents read coverage normalized by (1,000,000/total reads), and the value range is indicated between brackets. Arcs connecting exons represent reads spliced across introns, with the number of spliced reads annotated over the line. Only arcs representing at least five reads are shown. b Enrichment map for genes involved in CGs in the HCT116 unstranded RNA-Seq data set. Each node represents a GO BP gene set. BP enriched in CG upstream partners have red cores, while BP enriched in downstream partners have red outer rings. Edge thickness indicates the level of CG partner overlap between gene sets. c CG counts per RNA-Seq library as detected by a modified deFuse classifier. d Top CG splicing patterns for the HCT116 unstranded RNA-Seq data set. Schematic shows the most abundant conjoined splicing relationships between in-cis gene pairs. Right of figure, percentage of all CG events (number of events in class) for HCT116 unstranded, HCT116 stranded, and 184hTERT stranded libraries, respectively. e Dose-dependent CG splicing pattern proportions across T3 concentrations for the HCT116 unstranded RNA-Seq data set. As T3 concentration is increased, more exons are skipped. See panel d for splicing patterns

