
Figure 2.
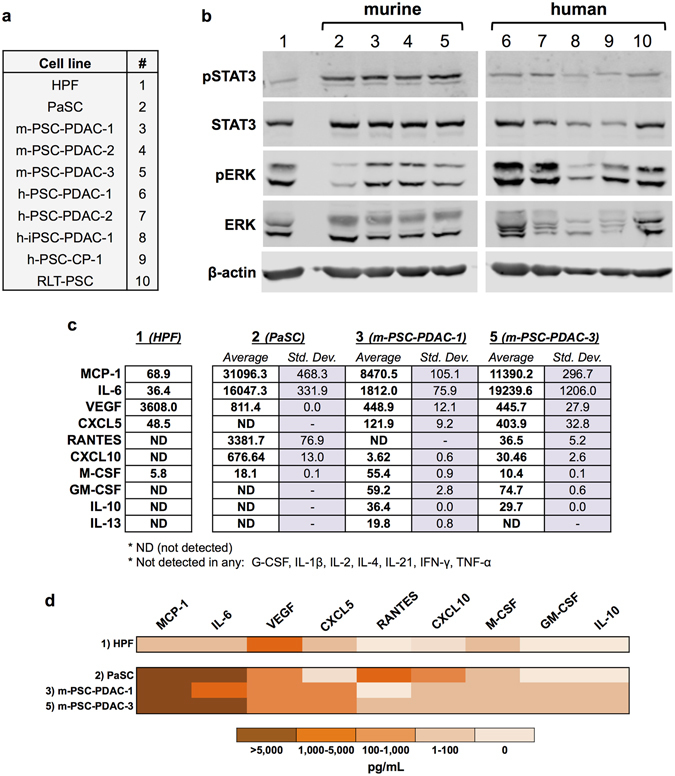
PSC display constitutive activation of STAT3 and MAPK signaling and secrete pro-inflammatory factors. (a) Summary of all PSC and PSC cell cultures used. (b) Cells were grown in DMEM and lysed once they reached 70–80% confluence for western blot analysis. pSTAT3, STAT3, pERK, and ERK were analyzed by immunoblot. β-actin served as a loading control. (c) Supernatants from 3 murine PSC cell lines and the human control pancreas-derived fibroblast line (HFP) (detailed in Table 1) were collected from 70% confluent cells grown in DMEM. A panel of cytokines and chemokines was analyzed in these supernatants by Luminex assay. Values are listed as an average of two replicates in pg/mL with the standard deviation. ND indicates analytes were assayed, but the levels were detected beneath the lowest standard curve reference value. (d) Selected results from the Luminex assay, presented as a heat map.