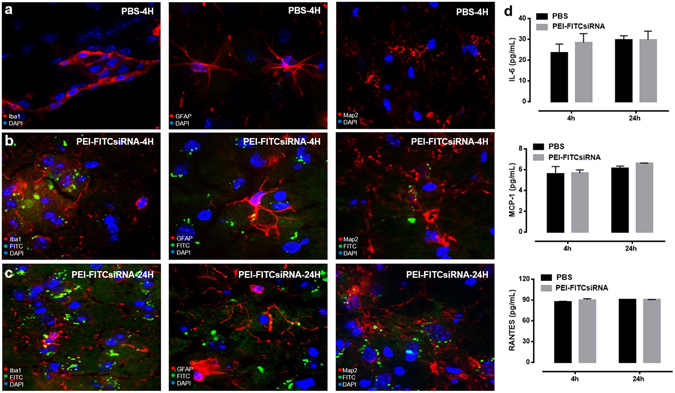
Figure 2.

Cell-type distribution of PEI-FITCsiRNA in mouse brain following intranasal administration. Representative images of brain sections immunolabeled with antibodies to the microglial marker, Iba1 (left panel), astrocyte marker, GFAP (middle panel), and neuronal marker, Map2 (right panel), in red for (A) PBS treatment, and PEI-FITCsiRNA (indicated by green fluorescence) administration for (B) 4 hours and (C) 24 hours. DAPI (blue) staining indicates cell nuclei at 63X magnification. (D) The other half of brain tissues was used to detect the indicated cytokines and chemokines by ELISA after 4 and 24 hours. Values were determined from standard curves and are presented as the mean ± the standard error of the mean (S.E.M.) of three independent experiments.
