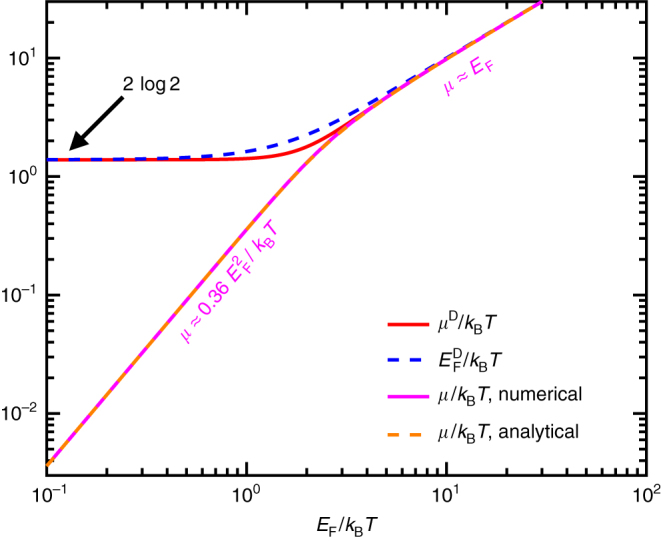
Fig. 6.

Graphene chemical potential and Drude weight. We show the relation between the chemical potential μ and the Fermi energy E F in graphene, both of them normalized to k B T. The direct numerical solution of Eq. (20) (pink solid curve) is nearly indistinguishable from the analytical expression of Eq. (21) (dashed orange curve). For completeness, we also plot the normalized Drude weight μ D/k B T [red solid curve, see Eq. (26)] and an approximate Drude weight (dashed blue curve)
