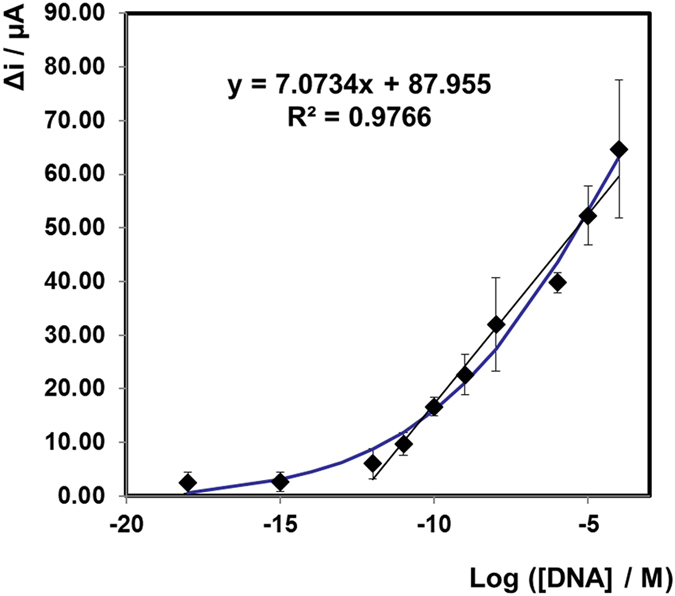
Figure 3.

Dependence of the difference in current before and after the addition of H2O2 on log[miRNA] on a gold slide electrode following hybridisation with probe miRNA that is labelled with PtNPs. The applied potential is −0.25 V in 1 mM DPBS. Δi represents the difference in current before and after addition of 20 µM H2O2. Error bars are from an n = 3 study and range from 4–13%. The calibration plot is fit with a 4 parameter logistic function (blue line).
