Figure 5.

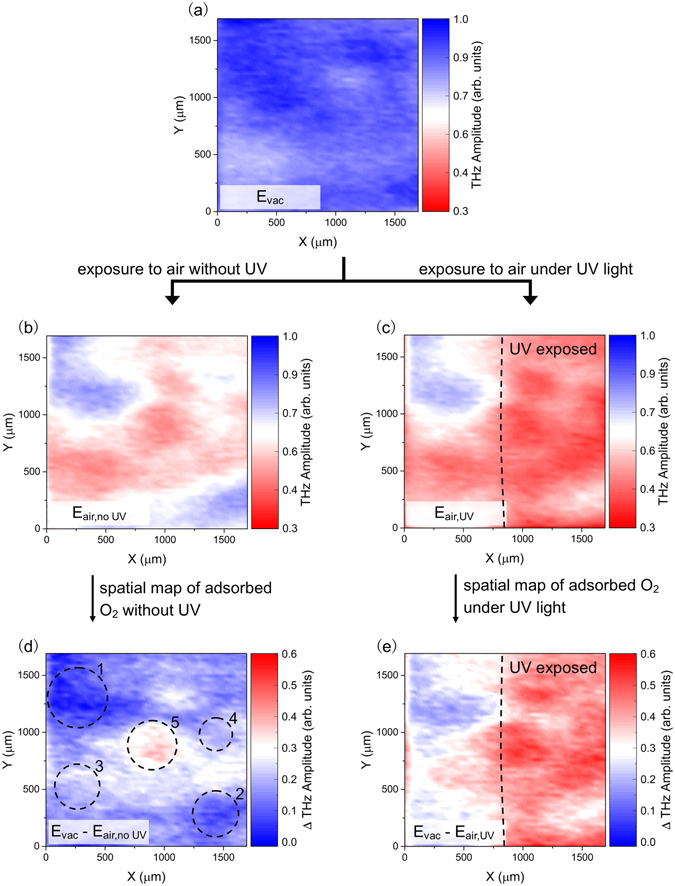
THz amplitude mapping during the O2 adsorption process. (a) THz amplitude mapping for CVD graphene/InP after annealing at 445 K in vacuum. THz mapping of the same area in sample after exposure to air for a few minutes (b) without and (c) with UV illumination. The difference in THz mapping images before and after exposure to air gives a visualization of adsorbed O2 molecules in the graphene surface. (d) Spatial map of adsorbed O2 molecules in graphene after exposure to air without UV illumination which reveals regions with different “natural” affinities to O2 molecules. Regions 1 and 2 (5) show the least (highest) amount of adsorbates after exposure to air, whereas regions 3 and 4 are areas with a fair amount of adsorbates. (e) Spatial map of adsorbed O2 molecules after exposure to air under UV illumination, showing significantly higher concentration of O2 adsorbates in the UV exposed part. In the THz amplitude maps (a–c), the blue (red) end of the scale signifies less (more) O2 molecules on the graphene surface, while in the ΔTHz amplitude maps (d and e), the blue (red) end of the scale signifies less (more) O2 molecules adsorbed/added on graphene during exposure to air.
