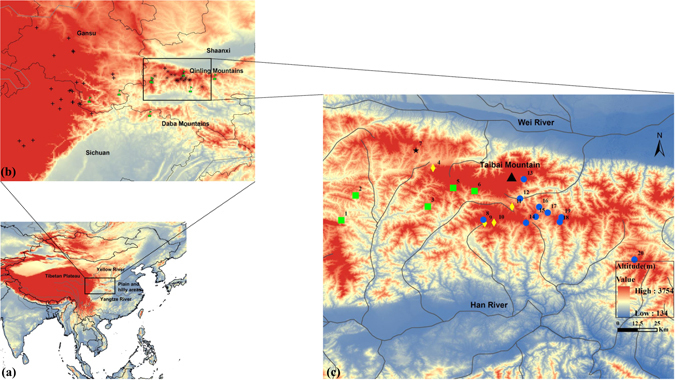
Figure 1.

Geographical distribution of B. tibetanus in China and sampling locations in the Qinling Mountains used in this study. (a) Geographical distribution of B. tibetanus across its main distribution range in China. (b) Distribution of the Tibet and eastern lineages of B. tibetanus. The Tibet lineage of B. tibetanus is labelled by cross including 24 locations from prior study25 and the QLC population of this study, and the eastern lineage is labelled by school (8 locations from prior study) and asterisk (19 of 20 sampling locations of this study). The eastern lineage of B. tibetanus is previously described as B. taibaiensis 35. (c) Sampling locations in the Qinling Mountains used in this study. The two major population lineages are labelled by green squares and blue circles, respectively. The yellow diamonds indicate populations possessing haplotypes from both lineages. The QLC population is labelled by a black star. The numbers indicate different populations (see Table 1). The optimal number of population groups is three revealed by the Spatial Analysis of Molecular Variance (SAMOVA). The western group consists of the population 1–6, the eastern group contains the population 8–20, and the third group contains only the QLC population. The main rivers in the distribution area are shown by lines, and the Taibai Mountain (3767 m) is labelled by a black triangle. The map was generated using ArcGIS 9.3 (http://www.esri.com/software/arcgis) and Adobe Illustrator CS4 v14.0.0 (Adobe Systems Inc., San Francisco, CA). The Digital Elevation Model (DEM) for Fig. 1c was downloaded from the website, which was provided by Data Center for Resources and Environmental Sciences, Chinese Academy of Sciences (RESDC) (http://www.resdc.cn).
