
Figure 3.
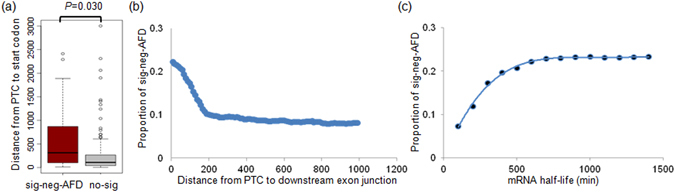
The relationship between the location of PTC and NMD. (a) The distance of PTC from start codons are shown for sig-neg-AFD mutations (red) and the other mutations (gray). (b) Scatterplot shows the distance of PTC to downstream exon junction. The x-axis is represented as a cumulative sum. The point is marked on every 10 nts. (c) The sig-neg-AFDs ratio are plotted against the mRNA half-life. The minutes on the x-axis are represented as a cumulative scale.