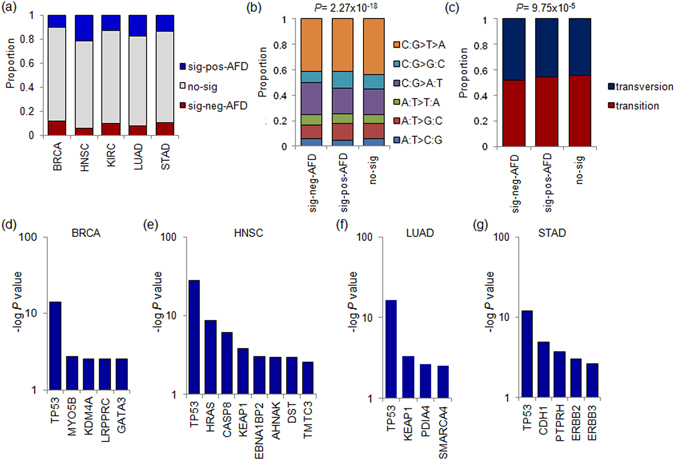
Figure 5.

AI at missense mutations. (a) Barplots show the relative proportion of sig-pos-AFD (blue), sig-neg-AFD (red), and the other mutations (gray) for missense mutations across five tumor types. The proportion was calculated for events in copy number neutral segments. (b) The mutation spectra are shown for the sig-pos-AFD, sig-neg-AFD and the other mutations. P value was calculated by Chi-square test. (c) The proportion of the transversion and transition mutations are shown for sig-pos-AFD, sig-neg-AFD and the others. P value was calculated by Chi-square test. (d) Significance level of genes are shown for the enrichment of sig-pos-AFD missense mutations in BRCA. Y-axis is -log P value (Fisher’s exact test). Genes with -log P value > 2.5 are shown. Similarly shown for HNSC (e), LUAD (f) and STAD (g). KIRC has no genes to be plotted by the criterion.
