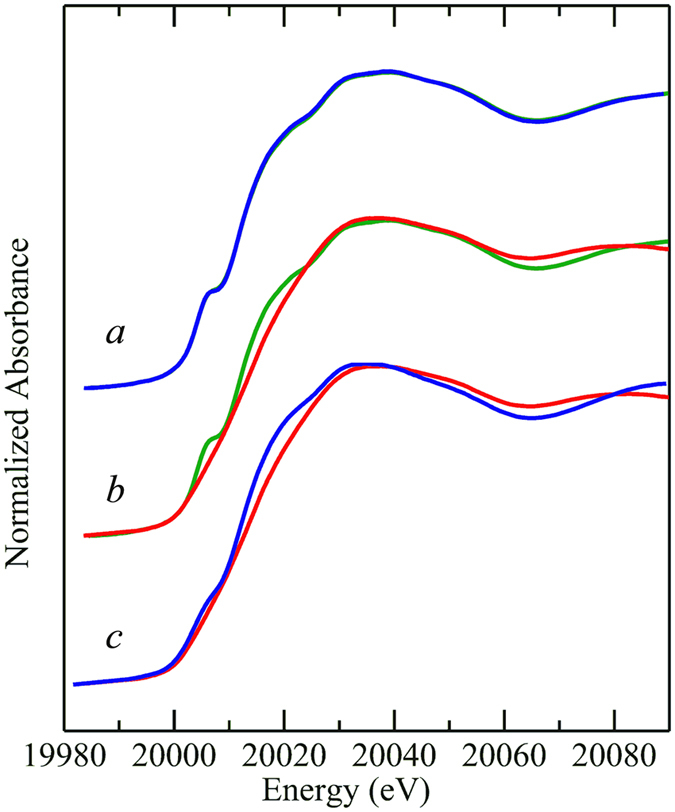
Figure 3.

Mo K-edge X-ray absorption near-edge spectra of NT-26 arsenite oxidase. The as-isolated enzyme is shown in a ( ) with the same form of the enzyme after addition of 5 mM arsenite (
 ). The two traces overlay almost completely within the width of the line, showing that there are no significant changes in the Mo site arising from addition of substrate. The effects of addition of 5 mM (final) ferricyanide solution are shown in b, with the as-isolated protein (
 ) verses the ferricyanide-oxidized enzyme (
 ). c shows the spectrum of ferricyanide-oxidized enzyme (
 ) compared with that of arsenite-reduced enzyme (
 ).
).
