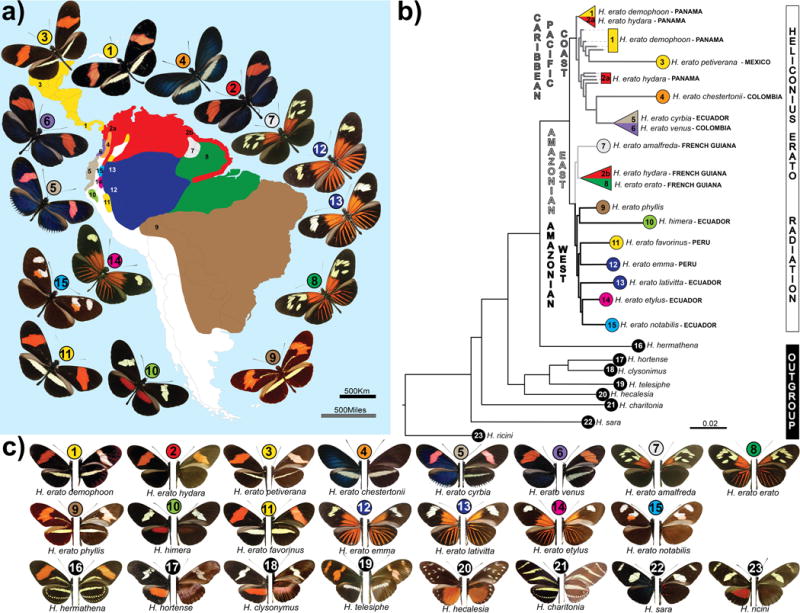
Figure 1. Geographical distribution, phylogeny and color pattern diversity of the Heliconius erato adaptive radiation.

(a.) Geographical origin of samples; colors represent the distribution of the races; numbers are placed according to the sampling sites. (b.) Maximum likelihood tree based on autosomal sites located on chromosomes that do not show any marked FST peaks. All nodes shown had full local support based on the Shimodaira-Hasegawa test. Color and numbers represent, respectively, the geographical distribution and sampling site. On average five individuals were sequenced for each race and two for each outgroup species. All samples used in this study were included in the tree. There were three cases, (triangles) where individuals did not cluster together by racial designation (see Figure S5 for the full genome tree). (c.) Pictures of dorsal (left) and ventral (right) sides of the wings of races and species used in this study. Bottom row with black circles represent species that belong to the erato clade, but not to the H. erato adaptive radiation.
