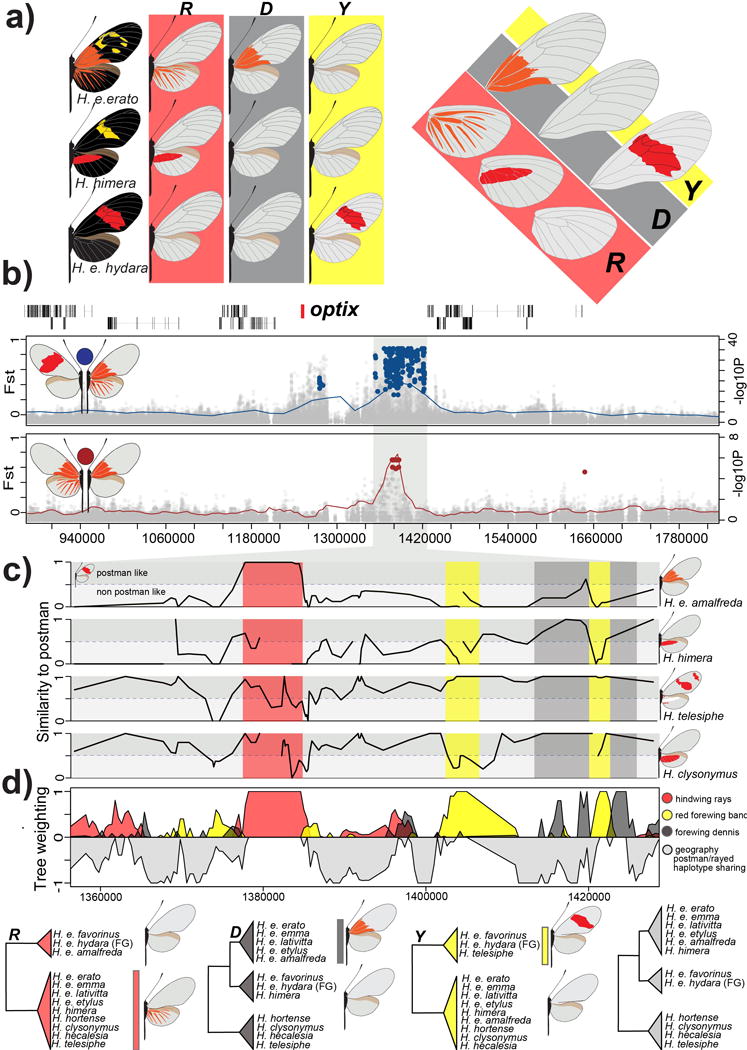
Figure 4. Modular architecture of red pattern variation.

(A.) Variation in red color patterning in the H. erato races in the ray (R), band (Y) and dennis (D) region of the wings. (B.) FST (lines; 20 kb window, 5 kb step size) and association (points) analysis at the peaks of divergence in the optix genomic region on chromosome 18 between races with red rays and dennis patch (ray-dennis) versus races with a red forewing band (postman) (red; top panel) and H. e. amalfreda (no rays) versus H. e. erato (rays) (brown; bottom panel). Colored points represent associations estimated from fixed SNPs. (C.) Genotype weightings (10 SNP window, 5 SNP step size, 3 SNPs minimum genotyped in 50% of population) of the positions that were identified as fixed between ray-dennis versus postman. A weighting of 1, means races or species have the same genotypes as the postman races, whereas a weighting of 0 indicates completely different genotypes in the considered window of fixed SNPs. (D.) Phylogenetic weighting of phenotypic hypothesis consistent with the R, Y and D elements. These weightings were obtained by summing weightings for topologies that were consistent with the hypothesized groupings presented in the phylogenies. Due to haplotype sharing among Rayed/Dennis and Postman races, tree topologies consistent with geography are never supported in this genomic interval. Support for topologies consistent with a geographic tree that accounts for this haplotype sharing are represented upside-down in gray. We outlined the following positions: 1,377,801–1,384,841 for R, 1,403,328–1,412,865 for Y1, 1,420,912–1,422,355 for Y2, 1,412,888–1,419,375 for D1 and 1,422,585–1,428,307 for D2 on chromosome 18. See SI, section 3.3.2 for the full phylogenetic trees of the identified intervals including all H. erato samples and closely related outgroup species.
