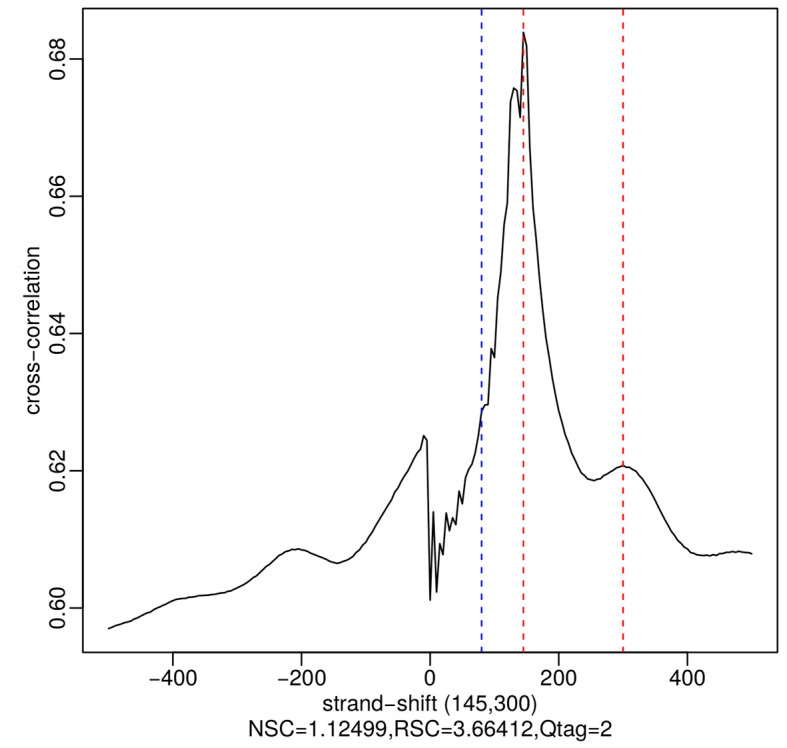
Figure 2. Plot of cross-correlation coefficient as a function of strand-shift for an example H3K27ac ChIP-seq sample, generated by the run_SPP_nodups.R script.

The blue dotted line shows the location of the phantom peak (i.e., read length) and the red dotted lines show the best and the second-best guesses (the two numbers in parentheses) of the fragment length. The fragment length estimates are identified as local maxima.
