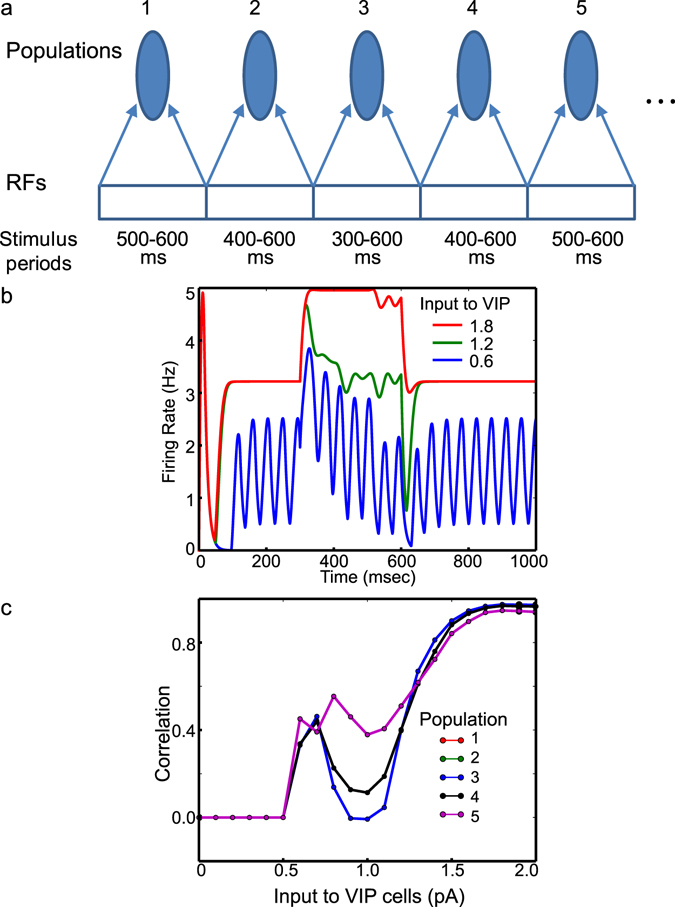
Figure 5.

The effects of VIP cell depolarization on responses to the object growing in size. (a) Method by which we simulate the object growing in size. (b) Pyr cell activity in population 4 between low (0.6 pA) and high (1.8 pA) input to VIP cells. For comparison, Pyr cell activity with the intermediate input (1.2 pA) to VIP cells is also displayed. (c) Dependency of population specific correlations between the stimulus inputs and Pyr cell responses on the input to VIP cells. Populations are distinguished using different colors. As populations 2 and 4 (1 and 5) show identical responses, only three lines are visible in (c).
