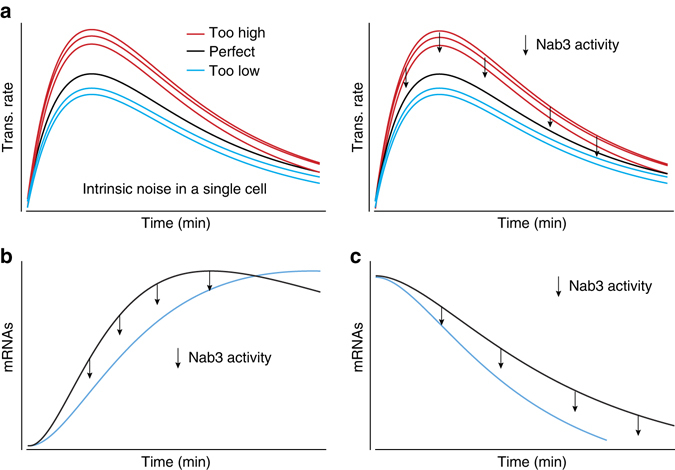
Fig. 10.

Models for how Nab3 could contribute to regulating gene expression during stress. a Shown is a schematic representation of typical gene expression profiles observed during stress responses. The black lines in the plots indicate the ideal gene expression profile. The red and cyan lines indicate variability in gene expression (either too high or too low). Here, Nab3-dependent transcription termination may function to prevent transcription from over-shooting. b,c Nab3 activity could also contribute to stress adaptation by either dampening the expression of a gene b, which would increase the response time, or its termination activity could contribute to rapidly shutting down expression of genes that are downregulated during stress c
