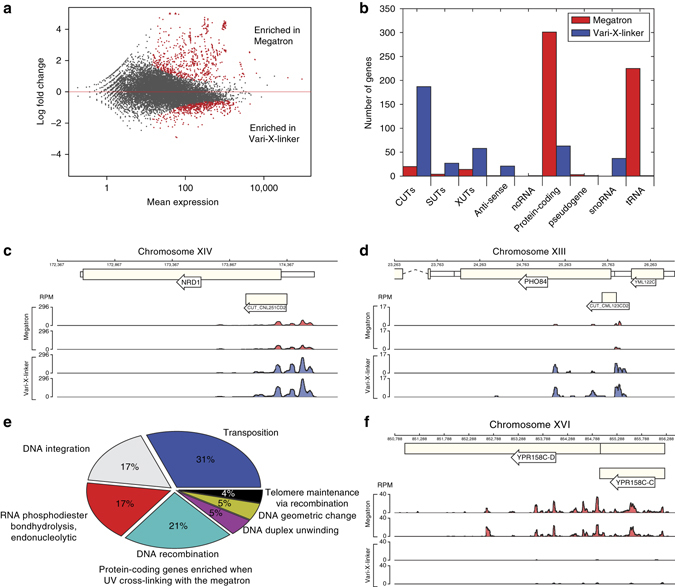
Fig. 2.

TheVari-X-linker allows better detection of Nab3 binding to short-lived RNA species and reduces the induction of the DNA damage response. a DESeq2 differential expression analysis of Megatron (two replicates) and the Vari-X-linker Nab3 CRAC data (four replicates). The red dots in the plot indicate the transcripts that differentially cross-linked in data from the two different UV cross-linkers. Transcripts with positive log2-fold change values are enriched in the Megatron data, whereas transcripts with negative log2-fold change values are enriched in the Vari-X-linker data. b Feature analyses of differentially cross-linked transcripts. The bar plot shows the number of genes (y-axis) in each genomic feature (x-axis) that were found to be significantly enriched (adjusted p-value < = 0.05) in the Megatron (red bars) and the Vari-X-linker (blue bars) data. SUTs: Stable Uncharacterized Transcripts. XUTs: Xrn1 Unstable Transcripts. CUTs: Cryptic Unstable Transcripts. ncRNA: non-coding RNA. c,d Genome browser examples of CUTs that show higher Nab3 binding in the Vari-X-linker data. The y-axis shows reads per million (RPM). e Pie chart showing the significantly enriched GO-terms (FDR < 0.01) in the ~300 protein-coding transcripts enriched in the Megatron data. f Genome browser graph of Nab3 cross-linking to transcripts originating from retrotransposable elements YPR158C-C and YPR158C-D. The y-axis shows reads per million (RPM)
