Fig. 3.

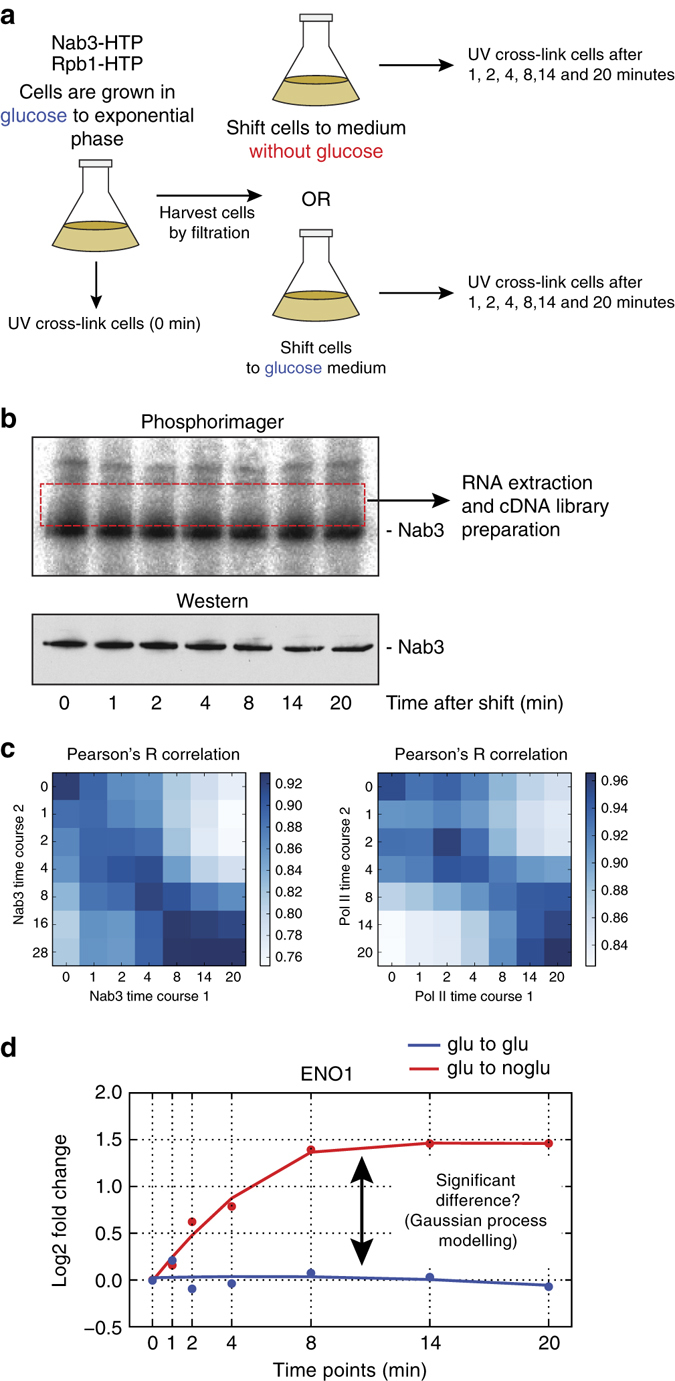
Time-resolved cross-linking analyses during glucose deprivation. a Outline of experimental set-up. Cells are grown in glucose medium to exponential phase. A fraction is cross-linked and harvested (t = 0 sample). The rest is rapidly harvested by filtration and transferred into medium lacking glucose or medium with glucose (control experiment). Subsequently, the cells were UV irradiated at the indicated times. b Nab3 cross-linking to RNA during glucose deprivation. Shown is a result of a typical χCRAC experiment. After resolving purified protein with RNAse digested radiolabeled cross-linked RNA on NuPAGE gels, the cross-linked RNA is detected by autoradiography. Western blotting was performed to ensure that comparable amounts of protein was recovered in each time-point. A cDNA library was subsequently prepared from RNA extracted from a single membrane slice containing RNA from all time-points. c Early time-points are highly correlated. The heat map shows a Pearson’s R correlation analysis of each individual time-point from Pol II and Nab3 replicate χCRAC experiments. The darker the blue color, the higher the Pearson’s correlation. Pearson correlations were calculated from log2 transformed FPKM (fragments per kilobase transcript per million reads) values. d A Gaussian process model was used to select genes that show significantly different cross-linking profiles between the control (glucose to glucose) and treated (glucose to no glucose) experiment. The example shows the ENO1 Pol II cross-linking profiles from a control (blue) and treated (red) experiment. The x-axis shows the time-points (minutes) at which samples were taken during the time-course. All data were normalized to the 0 time-point. The y-axis shows the log2-fold changes in FPKMs
