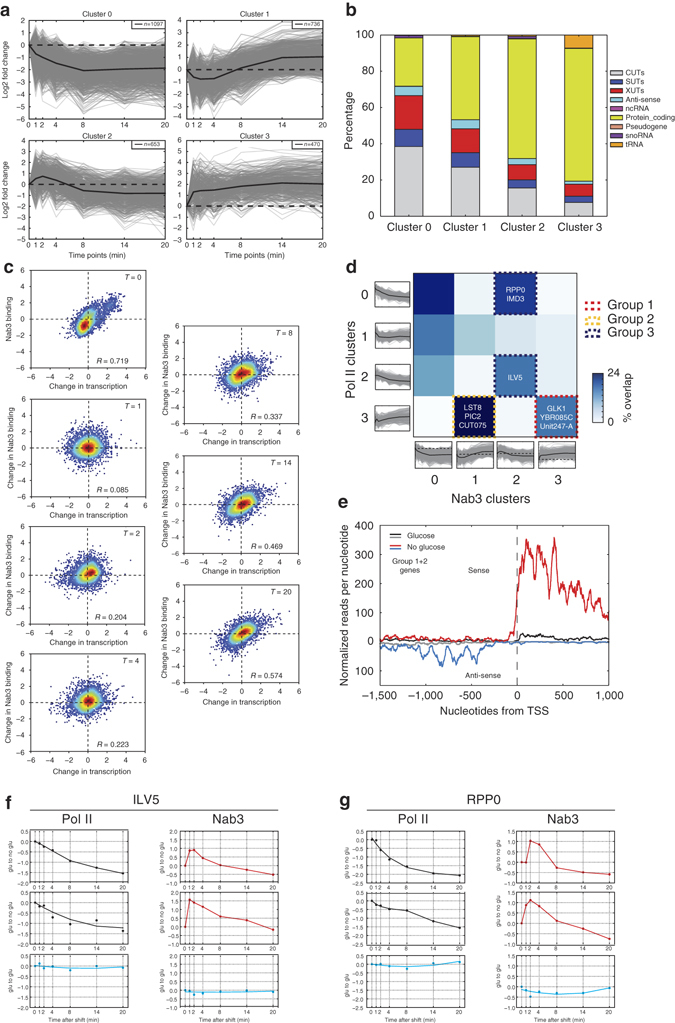
Fig. 5.

Dynamic binding of Nab3 to many transcripts during glucose deprivation. a Clusters of all Nab3 cross-linking profiles generated by K-means clustering, performed using STEM60. Only profiles were selected that showed a maximum fold-change of at least 1.5 and had a mean pairwise correlation over two biological replicates of 0.7. The y-axis shows the log2-fold change of each time-point relative to time-point 0 (glucose sample). The x-axis shows the time-points (minutes) after the shift to medium lacking glucose that were analyzed. b Bar chart indicating the percentage of different RNA classes in each cluster. c Scatter plots comparing the Nab3 binding (x-axis) to Pol II transcription (y-axis) for the indicated time-points (minutes) after inducing glucose starvation. To compare the Nab3 and Pol II time-point 0 data we Z-normalized the FPKM values. For time-points 1 to 20 we divided the FPKM values at each time-point by the time-point zero data, which were then Z-normalized. d The heat map shows what fraction of the genes belonging in each Pol II K-means cluster (y-axis) were also found in each Nab3 cluster (x-axis). Dashed lines indicate groups of genes with specific Nab3 and Pol II cross-linking profiles. e Shown is the cumulative read density of genes belonging to groups 1 and 2 around the annotated TSS. The black and gray lines show the sense and anti-sense read densities, respectively, for the glucose data. The red and blue lines show the sense and anti-sense read densities, respectively, for the glucose-deprived cells (14 min after the shift). f,g Examples of genes (ILV5 and RPP0) showing a decrease in Pol II transcription and transient cross-linking of Nab3. Biological replicates of the glucose to no glucose (black and red lines) are shown. The blue lines show data from glucose to glucose control experiments. y-axis shows fold-change relative to time-point 0
