Fig. 6.

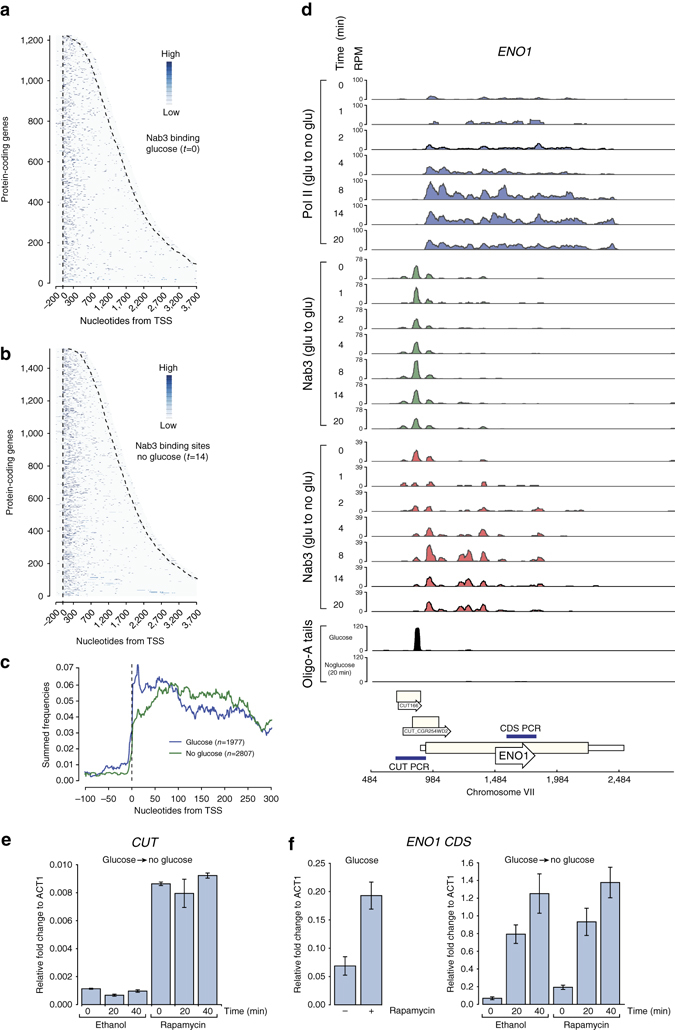
Nab3 binds to different sites in protein-coding transcripts during glucose deprivation. a The heat map displays the distribution of Nab3-binding sites across protein-coding genes (y-axis) that were aligned by the TSS (x-axis) and sorted by length. The dashed lines indicate the TSS and 3′-end, respectively. Shown is the glucose data (t = 0). b Same as in a but now for the t = 14 no glucose time-point. c Distribution of Nab3-binding sites around the TSS. For each Nab3 protein-coding target, the distribution frequency of the binding sites was plotted around the TSS (x-axis). These frequencies were subsequently summed (y-axis) to generate this distribution plot. The blue line indicates the data from the glucose experiment (t = 0). The green line shows the data from the no glucose t = 14 time-point. d Genome browser images showing the results of the Pol II control χCRAC experiment (top panel; blue), Nab3 control χCRAC experiment (green), the Nab3 glucose to no glucose χCRAC experiment (red) and the total amount of oligo-A tailed reads for the ENO1 gene. The time-points (minutes) at which samples were harvested after shifting the cells to medium lacking glucose is indicated on the left side of each track. e,f qRT-PCR analyses of ENO1 and upstream CUT levels. Cells were grown in glucose, treated with rapamycin or ethanol for 1 h and subsequently rapidly shifted to medium lacking glucose. RNA was extracted from cells before (0) and 20, 40 min after the shift. The qRT-PCR data were normalized to the levels of ACT1, as both the mRNA levels and the Pol II cross-linking profiles for this gene did not significantly change during the time-course (Supplementary Fig. 9a). ENO1 mRNA levels were quantified using RT-PCR oligonucleotides that amplify a region that is located downstream of the main Nab3 cross-linking sites (see d, bottom track). To detect the upstream CUT in e, we used oligonucleotides that amplify the CUT region, including the Nab3-binding sites upstream of the ENO1 TSS. The left bar in f shows the effect of Nab3 depletion on ENO1 mRNA levels in cells grown in glucose. The right bar plot in f shows the results for the whole time-course. Error bars indicate s.d. from three to four experimental replicates
