Fig. 7.

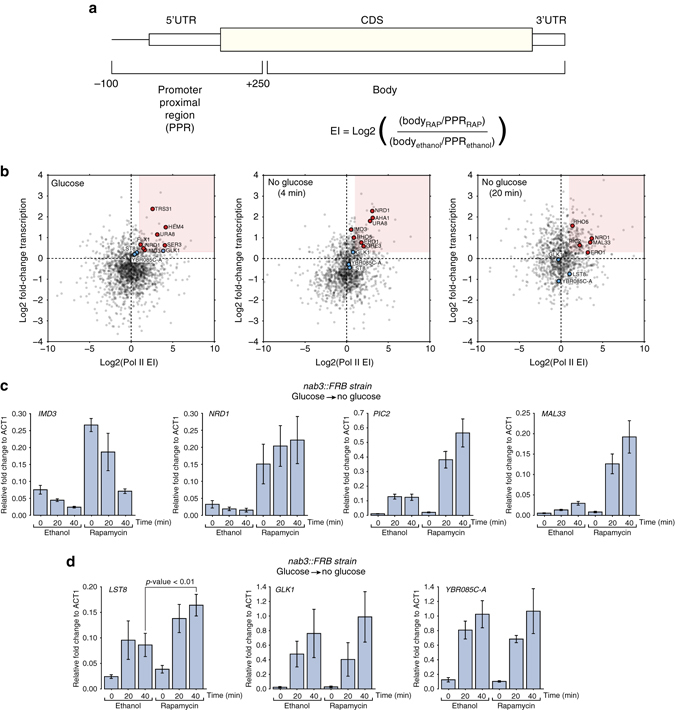
Nab3 regulates the timing of expression of stress-responsive genes. a Schematic representation of how escape factors (EI) were calculated. For more details, see the Methods section. b Nab3 targets different transcripts during glucose deprivation. The scatter plot shows the comparison of escape indices (EIs) and changes in Pol II transcription for protein-coding genes before the shift (0) and 4 and 18 min after the shift to medium lacking glucose. The red square indicates genes that showed at least a 1.5-fold increase in transcription and an EI of at least 2. The red dots indicate genes that could potentially be attenuated by Nab3. The blue dots indicate genes that, based on the EI, are less likely to be regulated by Nab3. c Quantitative RT-PCR analyses of IMD3, NRD1, PIC2, and MAL33 transcripts during a glucose starvation experiment. Cells were grown in glucose to exponential phase, treated with rapamycin or ethanol for 1 h and subsequently rapidly shifted to medium lacking glucose (but supplemented with rapamycin). RNA was extracted from cells before (0) and 20, 40 min after the shift to medium lacking glucose. d Same as in c but now for genes that based on the calculated EI are less likely to be regulated by Nab3. Error bars indicate s.d. from three to four experimental replicates. The p-value was calculated using an Welch’s t-test on the data from the 40-min time-points
