Fig. 8.

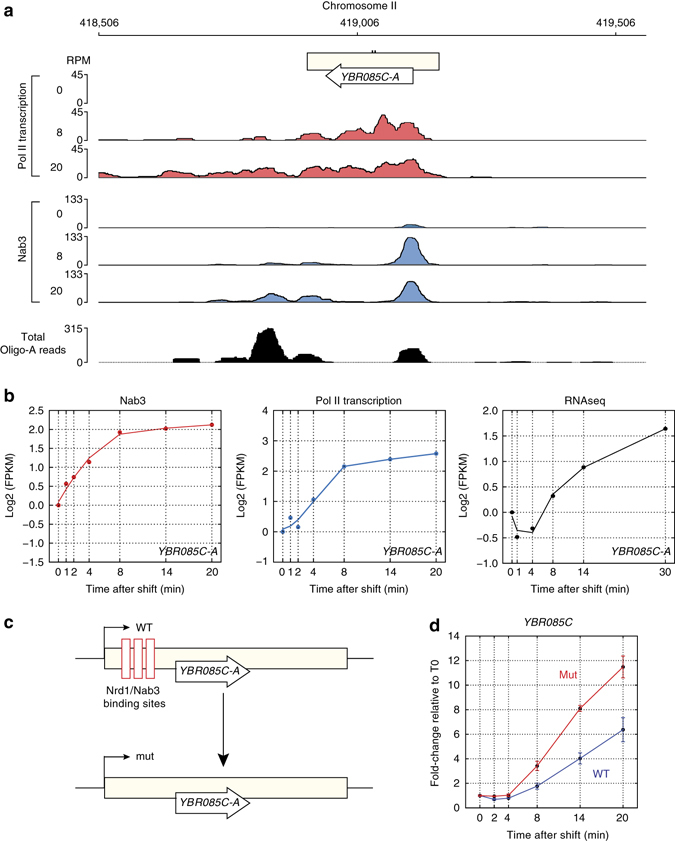
Nab3 induces changes in YBR085C-A expression kinetics. a Genome browser image showing the Pol II (red) and Nab3 (green) χCRAC data for the YBR085C-A region from cells harvested before (0) or 8 and 20 min after the shift to medium lacking glucose. The bottom panel shows the total number of reads with short oligo-A tails mapped to this region. b The plots show the log2-transformed FPKMs (y-axis) for the YBR085C-A transcript from the Nab3 χCRAC, Pol II χCRAC, and RNASeq data. The x-axis indicates the time (in minutes) after the shift to medium lacking glucose. c Schematic representation of how the YBR085C-A Nrd1-Nab3 site mutant was generated. Nrd1 and Nab3 motifs that overlapped with the main Nab3 cross-linking sites in the 5′ end of YBR085C-A were mutated (without changing the amino-acid sequence). d Quantitative RT-PCR results on total RNA isolated from the wild-type (WT) and YBR085C-A mutant (mut) strain during a glucose deprivation time-course. The y-axis shows fold change in signal relative to the 0 (glucose) sample. Error bars indicate s.d. from three to four experimental replicates
