Fig. 9.

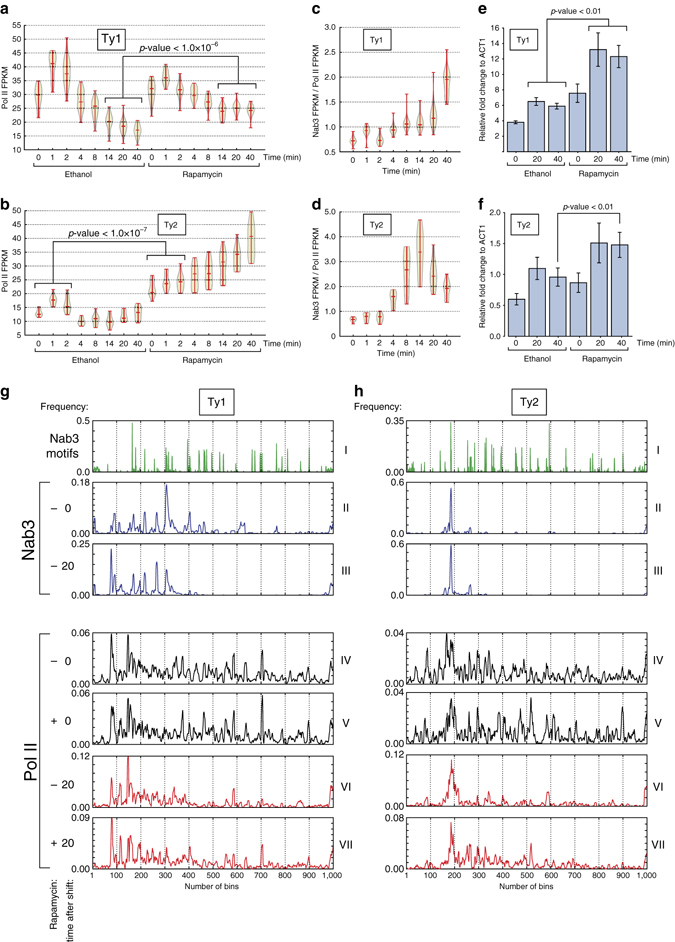
Nab3 regulates the expression of retrotransposons during glucose deprivation. a,b Violin plot showing the Pol II FPKMs for Ty1 and Ty2 retrotransposons from the nab3::frb rpo21-HTP χCRAC data generated in the presence of solvent (ethanol) or rapamycin. Shown are the averaged FPKMs from two biological replicates. Time (min) indicates the number of minutes in medium lacking glucose (but supplemented with rapamycin). The p-values were generated using Welch’s t-test. c,d Dynamic cross-linking of Nab3 to Ty1 and Ty2. The violin plot shows Ty1 and Ty2 FPKM distribution from a Nab3 χCRAC time-course experiment. The Nab3 χCRAC data were normalized to the average Pol II ethanol data shown in a,b. e,f Quantitative RT-PCR analysis of Ty1 and Ty2 retrotransposon transcript levels during a glucose starvation time-course. The x-axis shows the time (minutes) after the shift to medium lacking glucose at which samples were harvested. The p-values were generated using a Welch’s t-test. g,h Plots showing the distribution of Nab3 motifs (CUUG and UCUU; panel I), Nab3 cross-linking and Pol II cross-linking to Ty1 and Ty2 transcripts. To normalize for transcript lengths, each gene was divided into 1000 bins (x-axis). Roman numerals indicate the results from individual experiments. The black plots show the Pol II profiles for cells grown in glucose in the presence or absence of rapamycin. The red plots show the Pol II profiles 20 min after the shift to medium lacking glucose, in the presence or absence of rapamycin. For each Ty transcript we calculated the fraction of reads that mapped to each bin for each individual transcript. These were subsequently summed (y-axis) to generate these profiles
