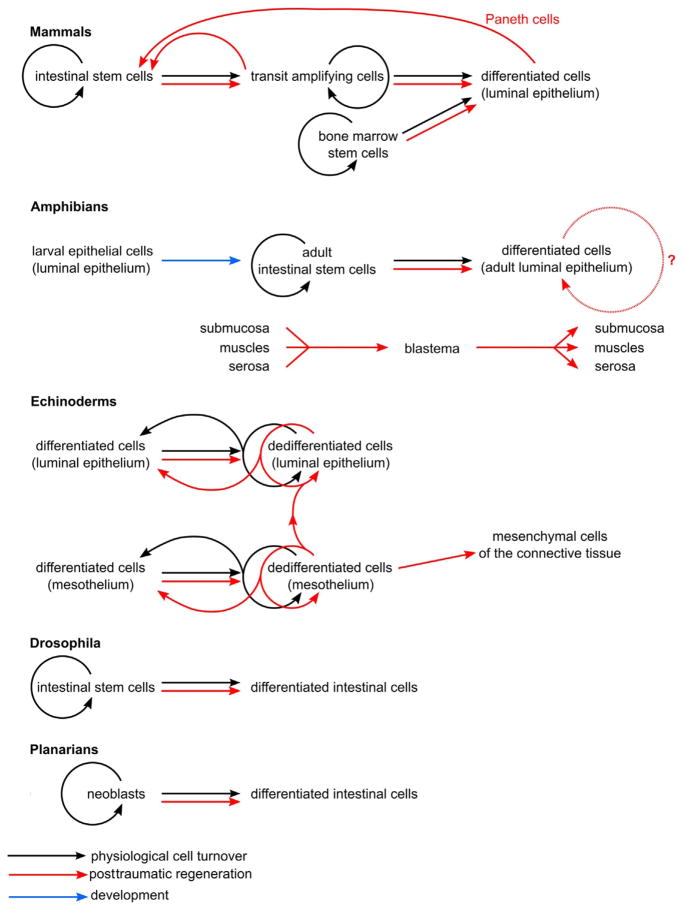
Figure 7.2.
Diagram summarizing cell lineage relationships in normal (physiological) cell turnover and posttraumatic regeneration in the digestive tube of different bilaterian animal models. Straight arrows show cell lineage relationships in physiological cell turnover (black), posttraumatic regeneration (red), and development (blue). Circular arrows indicate self-renewal.

