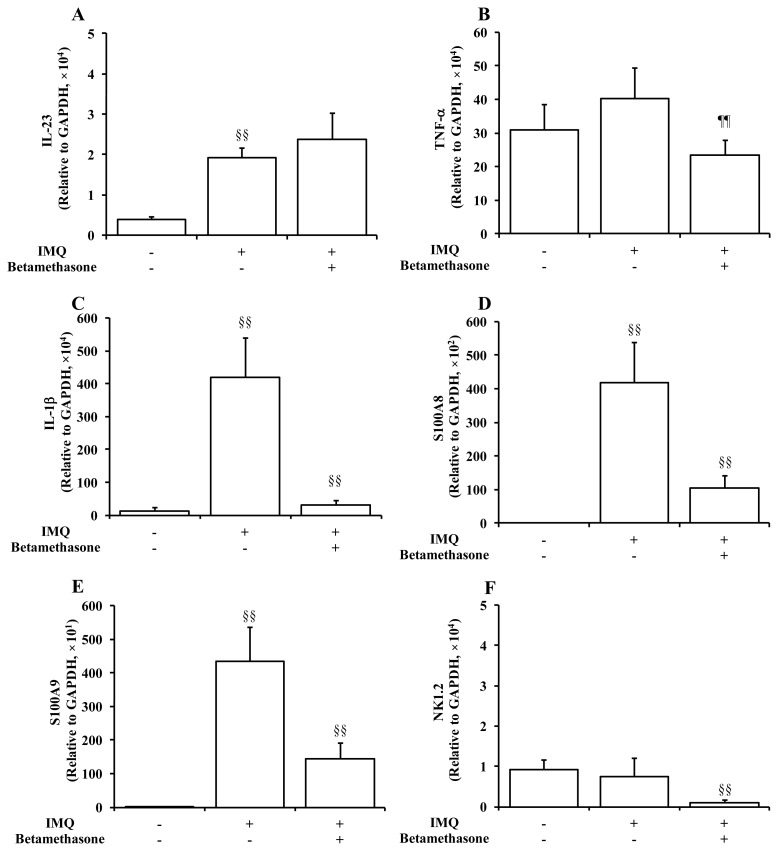
Figure 5.
Effects of application of 2 x 250 μg of IMQ and 5 μL of 0.05% betamethasone on mRNA transcripts expression levels of inflammatory cytokines and substances in ear tissue on Day 5. Normal control animals received neither IMQ nor vehicle cream. Data represent mean expression levels in the normal group, the IMQ group, and the IMQ + betamethasone treatment group, relative to a control house-keeping gene (GAPDH) + S.D. (n = 8–10). §§: p < 0.01. IMQ vs. Normal group or IMQ + betamethasone vs. IMQ group (Steel-Dwass test), ¶¶: p < 0.01. IMQ + betamethasone vs. IMQ group (Tukey’s test).

