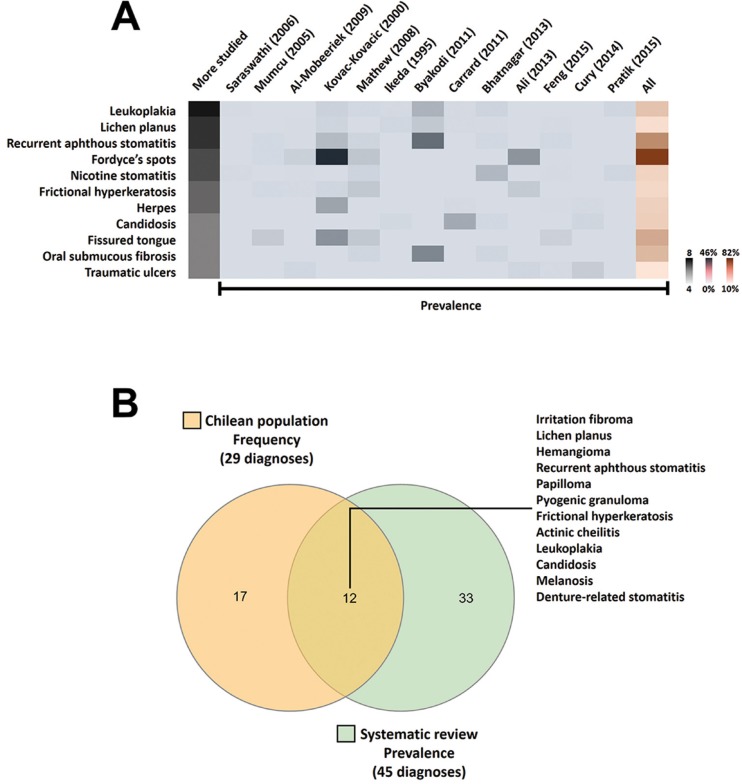
Figure 3.
Relevant diagnoses. Top five ranking for more studied lesions in the systematic review (3A). ODs reported in ≥4 articles. The heat map combines the most frequent lesions (leukoplakia to traumatic ulcers), rates by number of articles (grey bar) and prevalence across studies (ordered by Google Scholar rank). Higher numbers represent intense and saturated colours (extreme values on the right-hand side). Venn diagram for the most frequent and prevalent diagnosis (3B). Comparison of rank lists for the current study (our sample), and systematic review (studies around the world). Twelve of the 17 diagnoses (70.6%) in our top ten ranking were shared with selected studies.

